Feature Overview
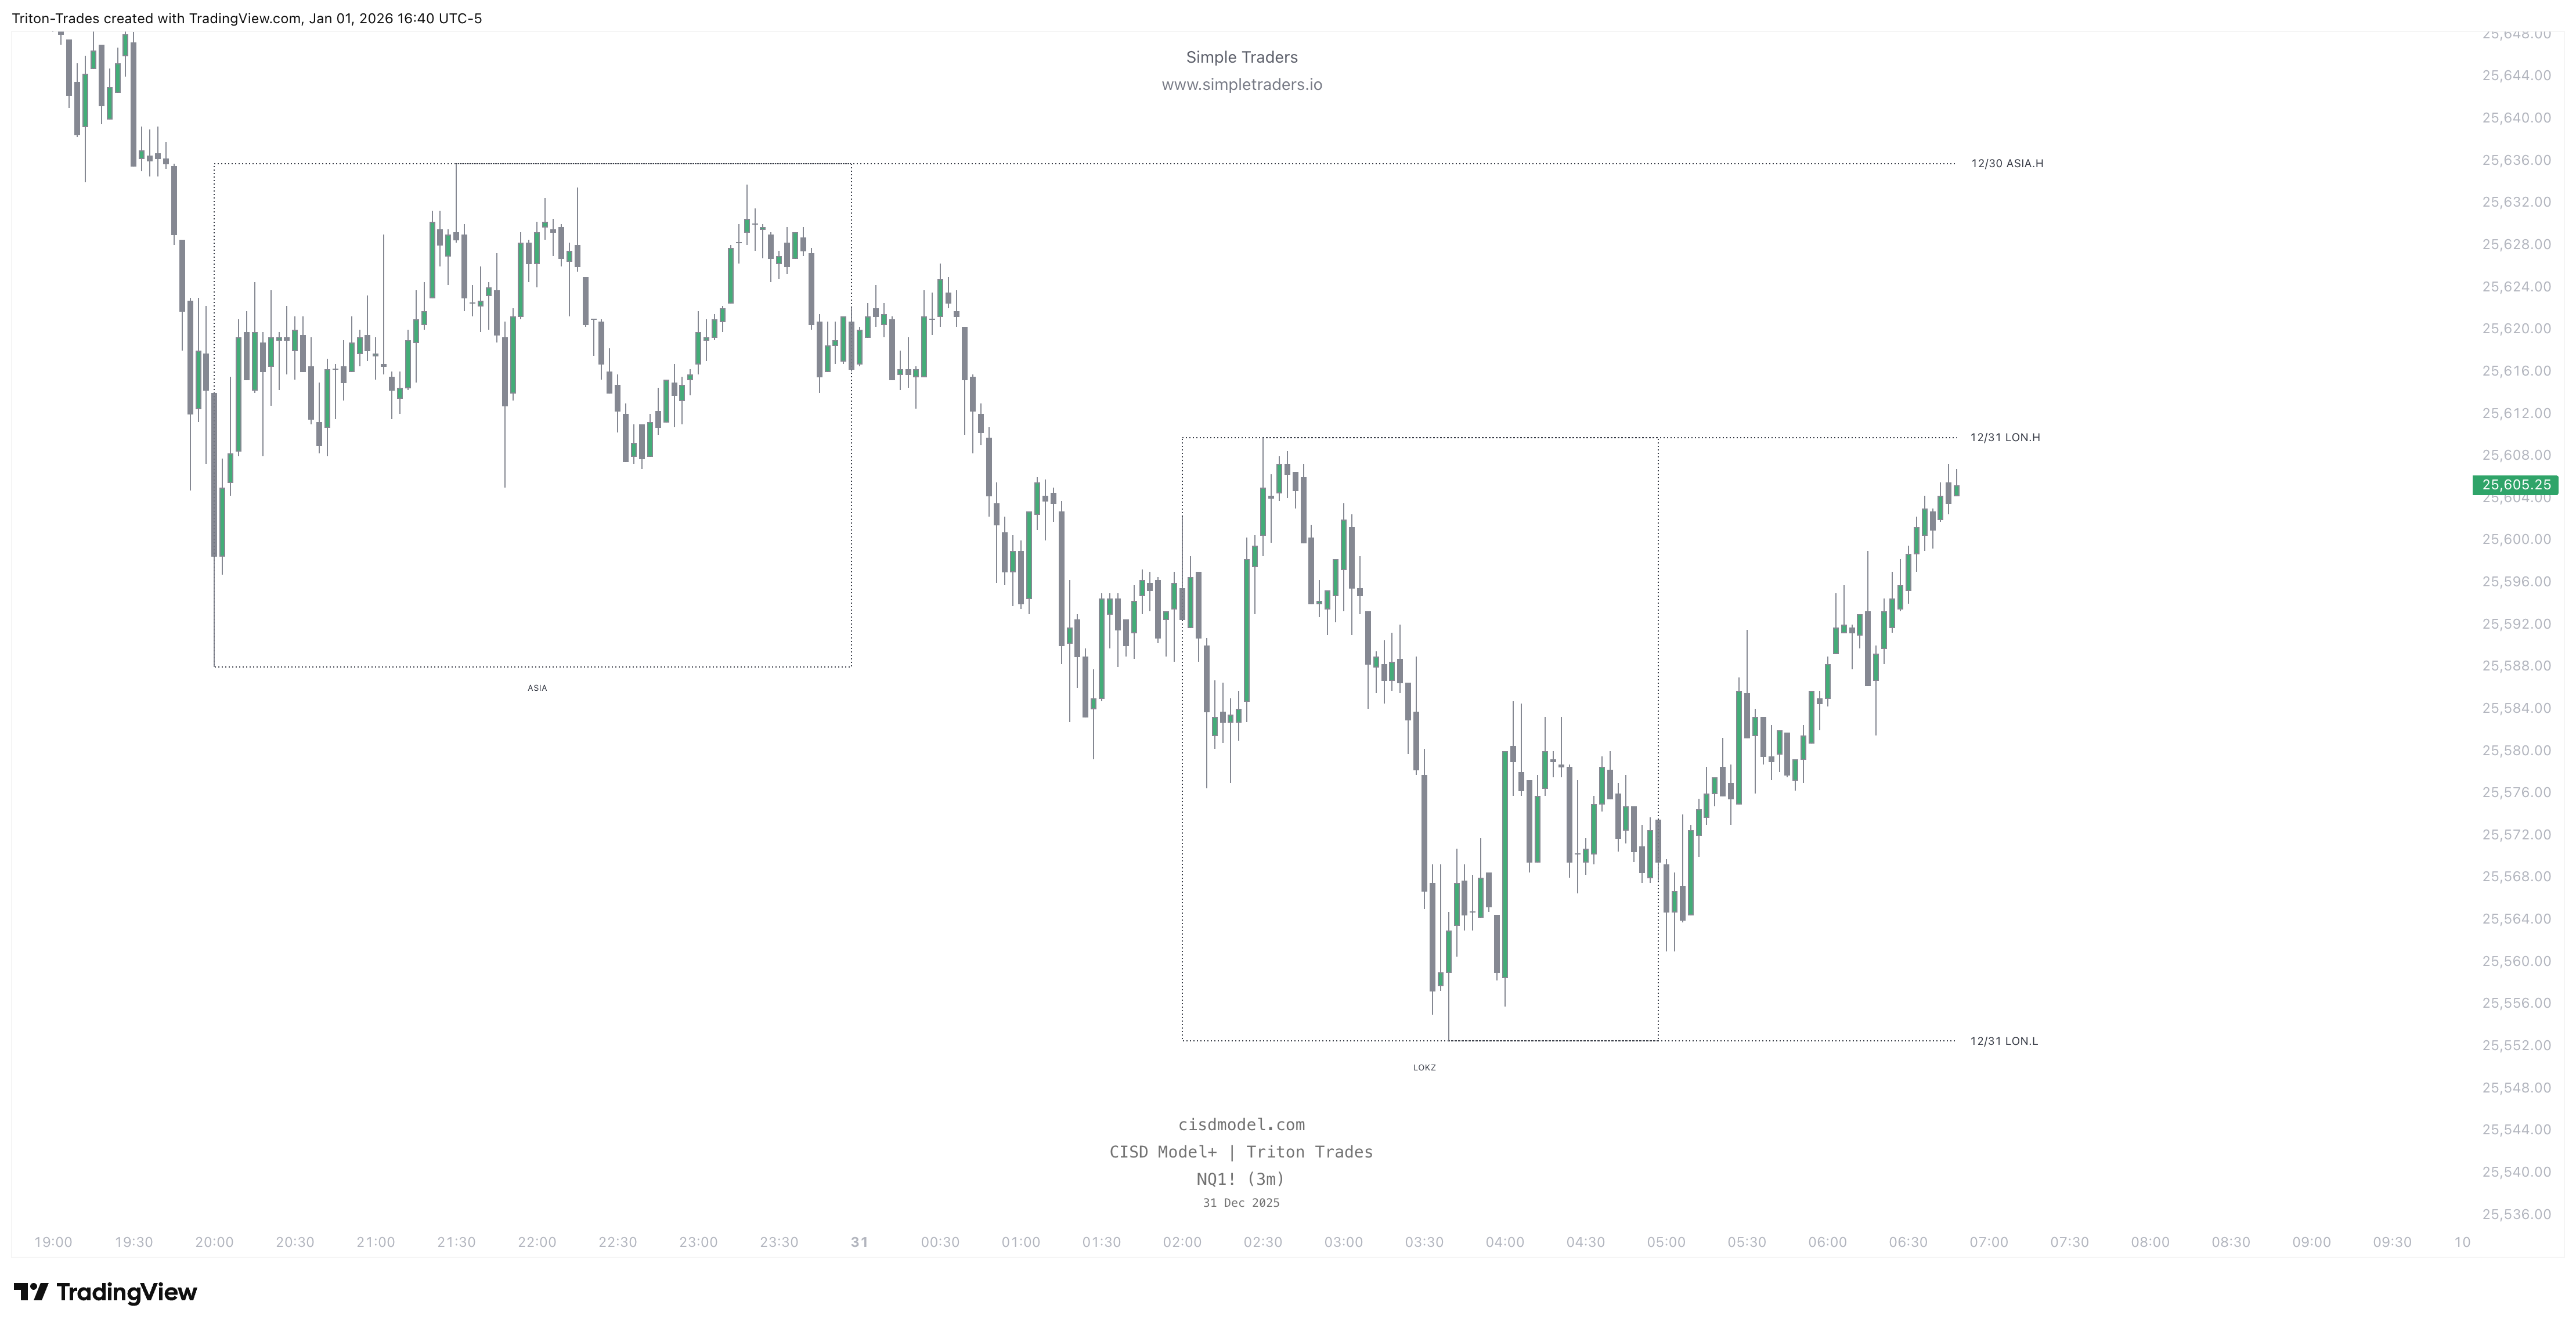
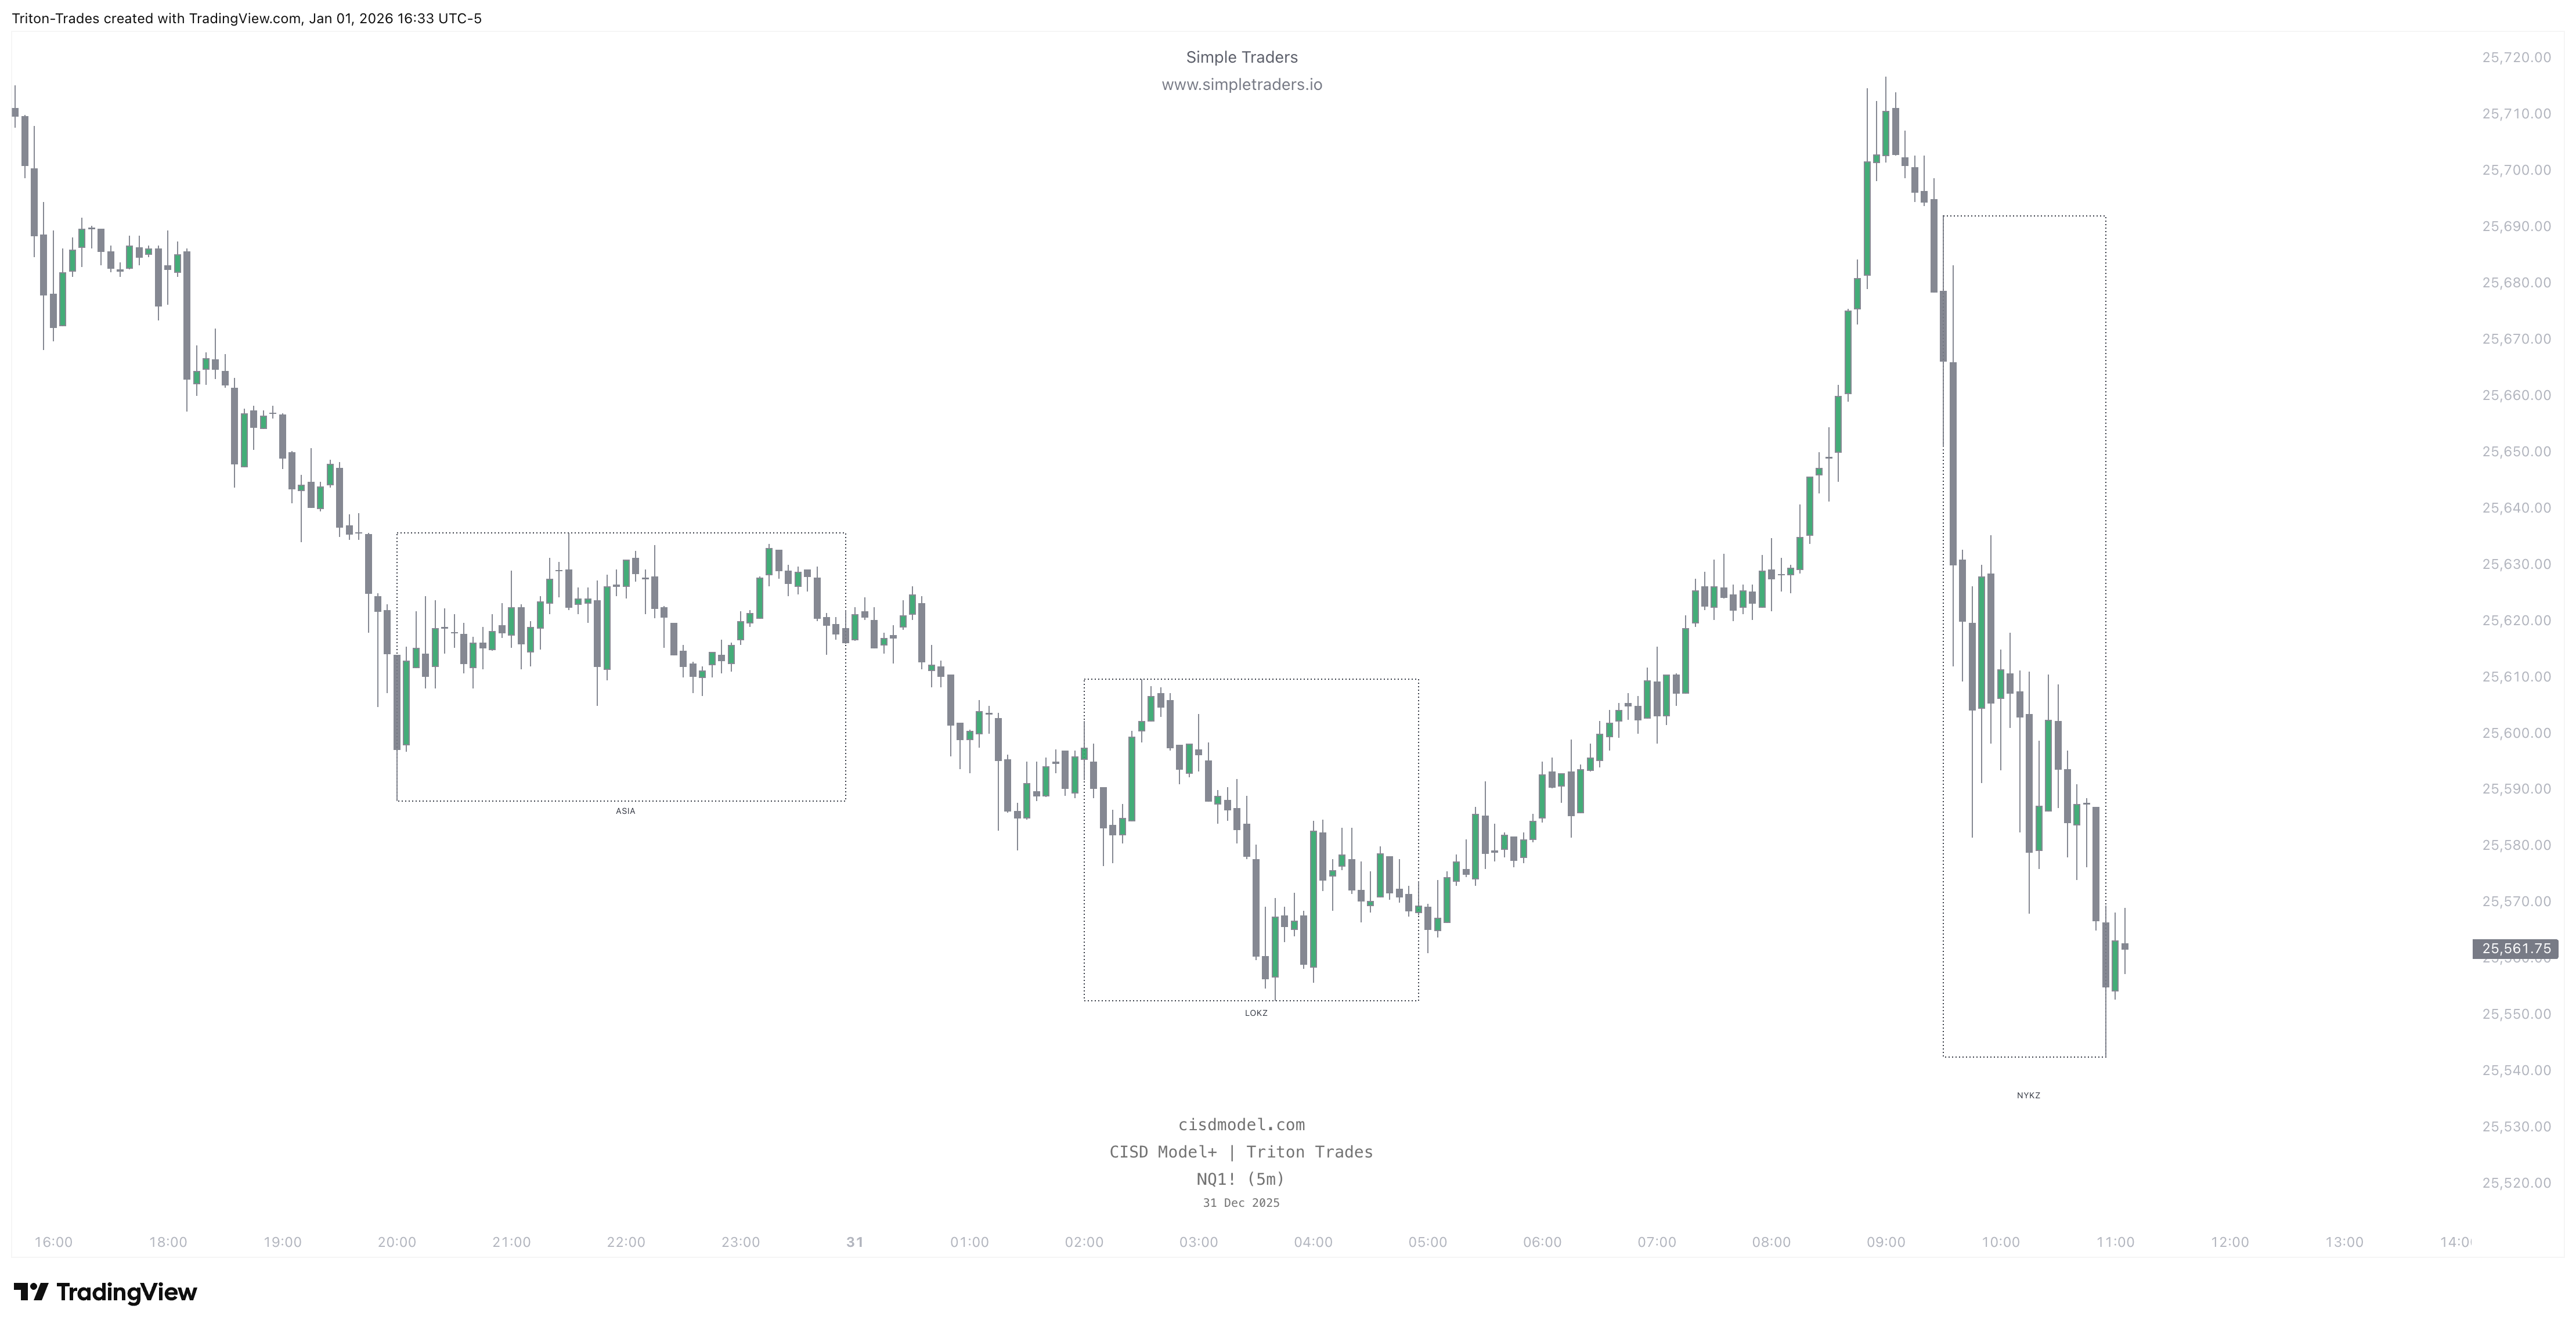
This feature marks out Session Liquidity on your charts. This is based on the highs and lows of Asia, London, New York sessions. You can also add & remove your own sessions by customizing the name & time window.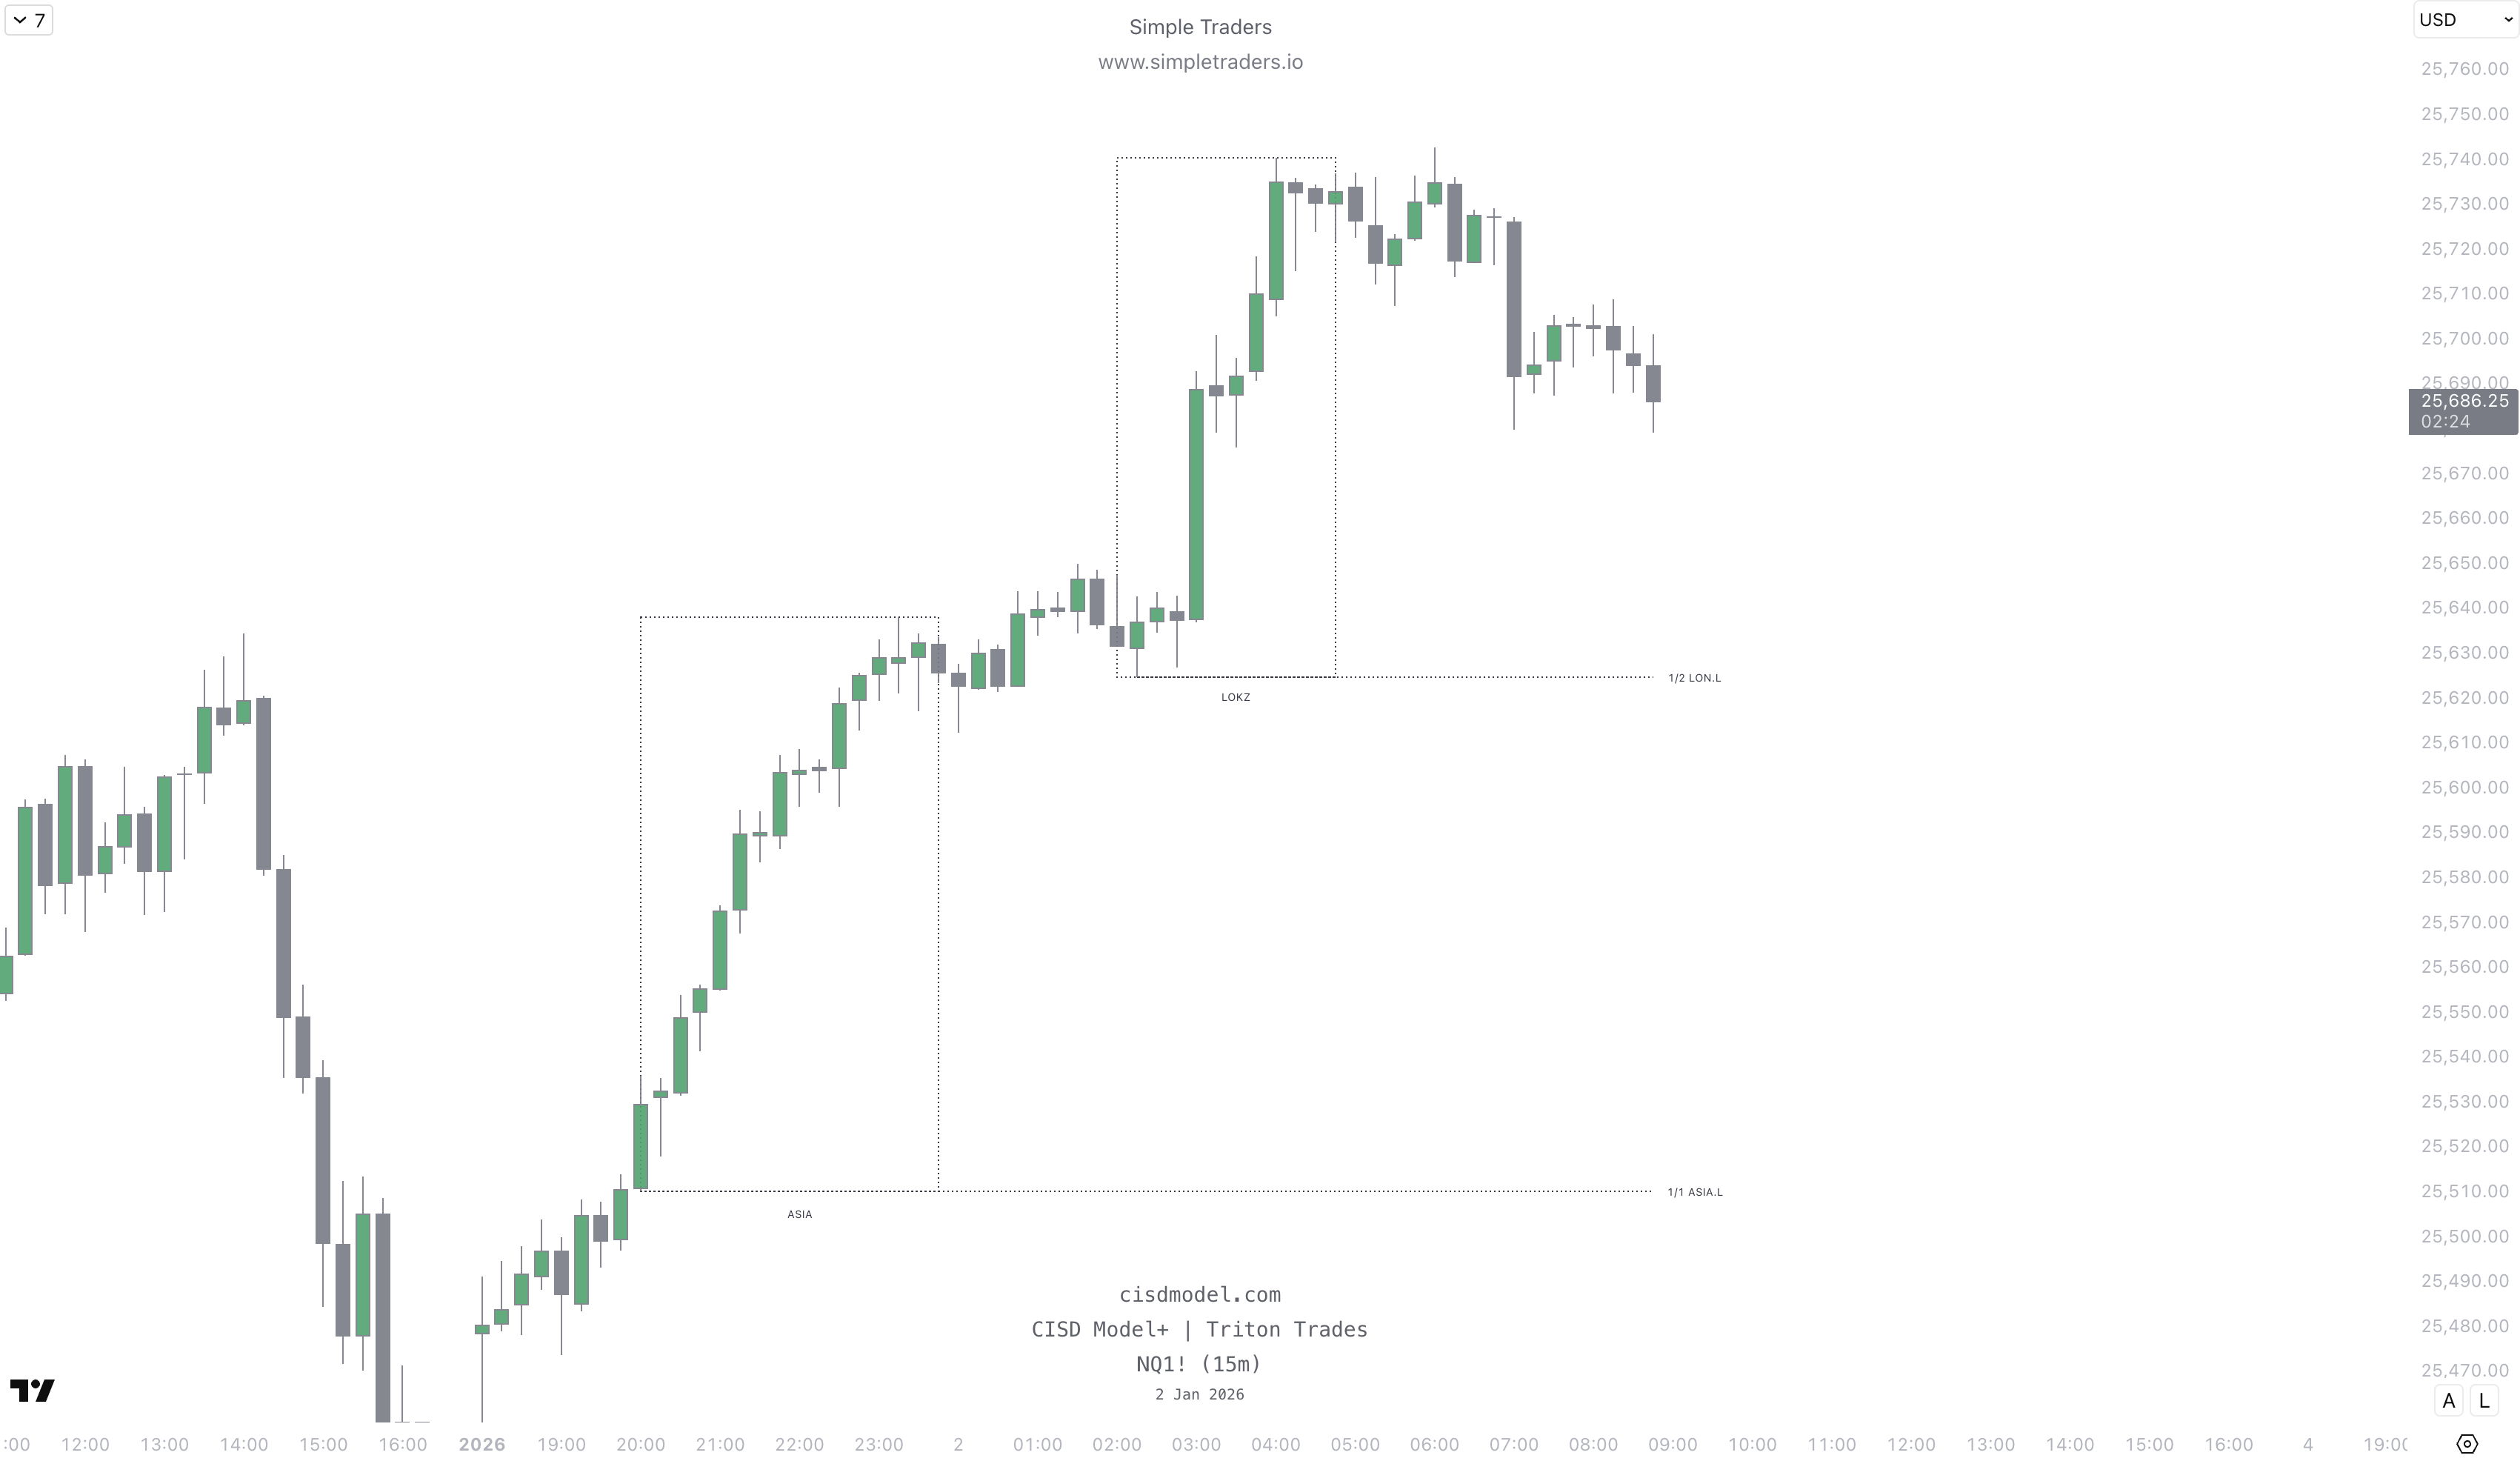
Lookback
You can select how far back to look for session liquidity.You can choose between 1 day, 3 days, and 1 week.
”Small” and “Dotted” refer to the label size and line style.
Preserve Session Liquidity After Mitigation
This will keep the session liquidity lines on the chart once price sweeps them.Keep it unchecked if you want the indicator to remove the lines after price sweeps the liquidity.
Show Borders
This shows the border for session boxes.Style refers to the border style (Dotted, Dashed, or Solid)
Transparent Fill - turn on for a transparent fill on the session boxes. Turn off for a solid fill.
Sessions
Customize the timings and colors for each session, and show or hide individual sessions.
Timeframe for Boxes:
Timeframe for Liquidity: