Feature Overview
Marks out CISDs on the higher timeframes compared to your current chart timeframe. For example, if you’re on the 1-minute chart, it will also identify & plot CISDs from the 2-minute or 3-minute chart. This helps you identify higher-probability CISDs and avoid constantly switching different timeframes to find the right CISD.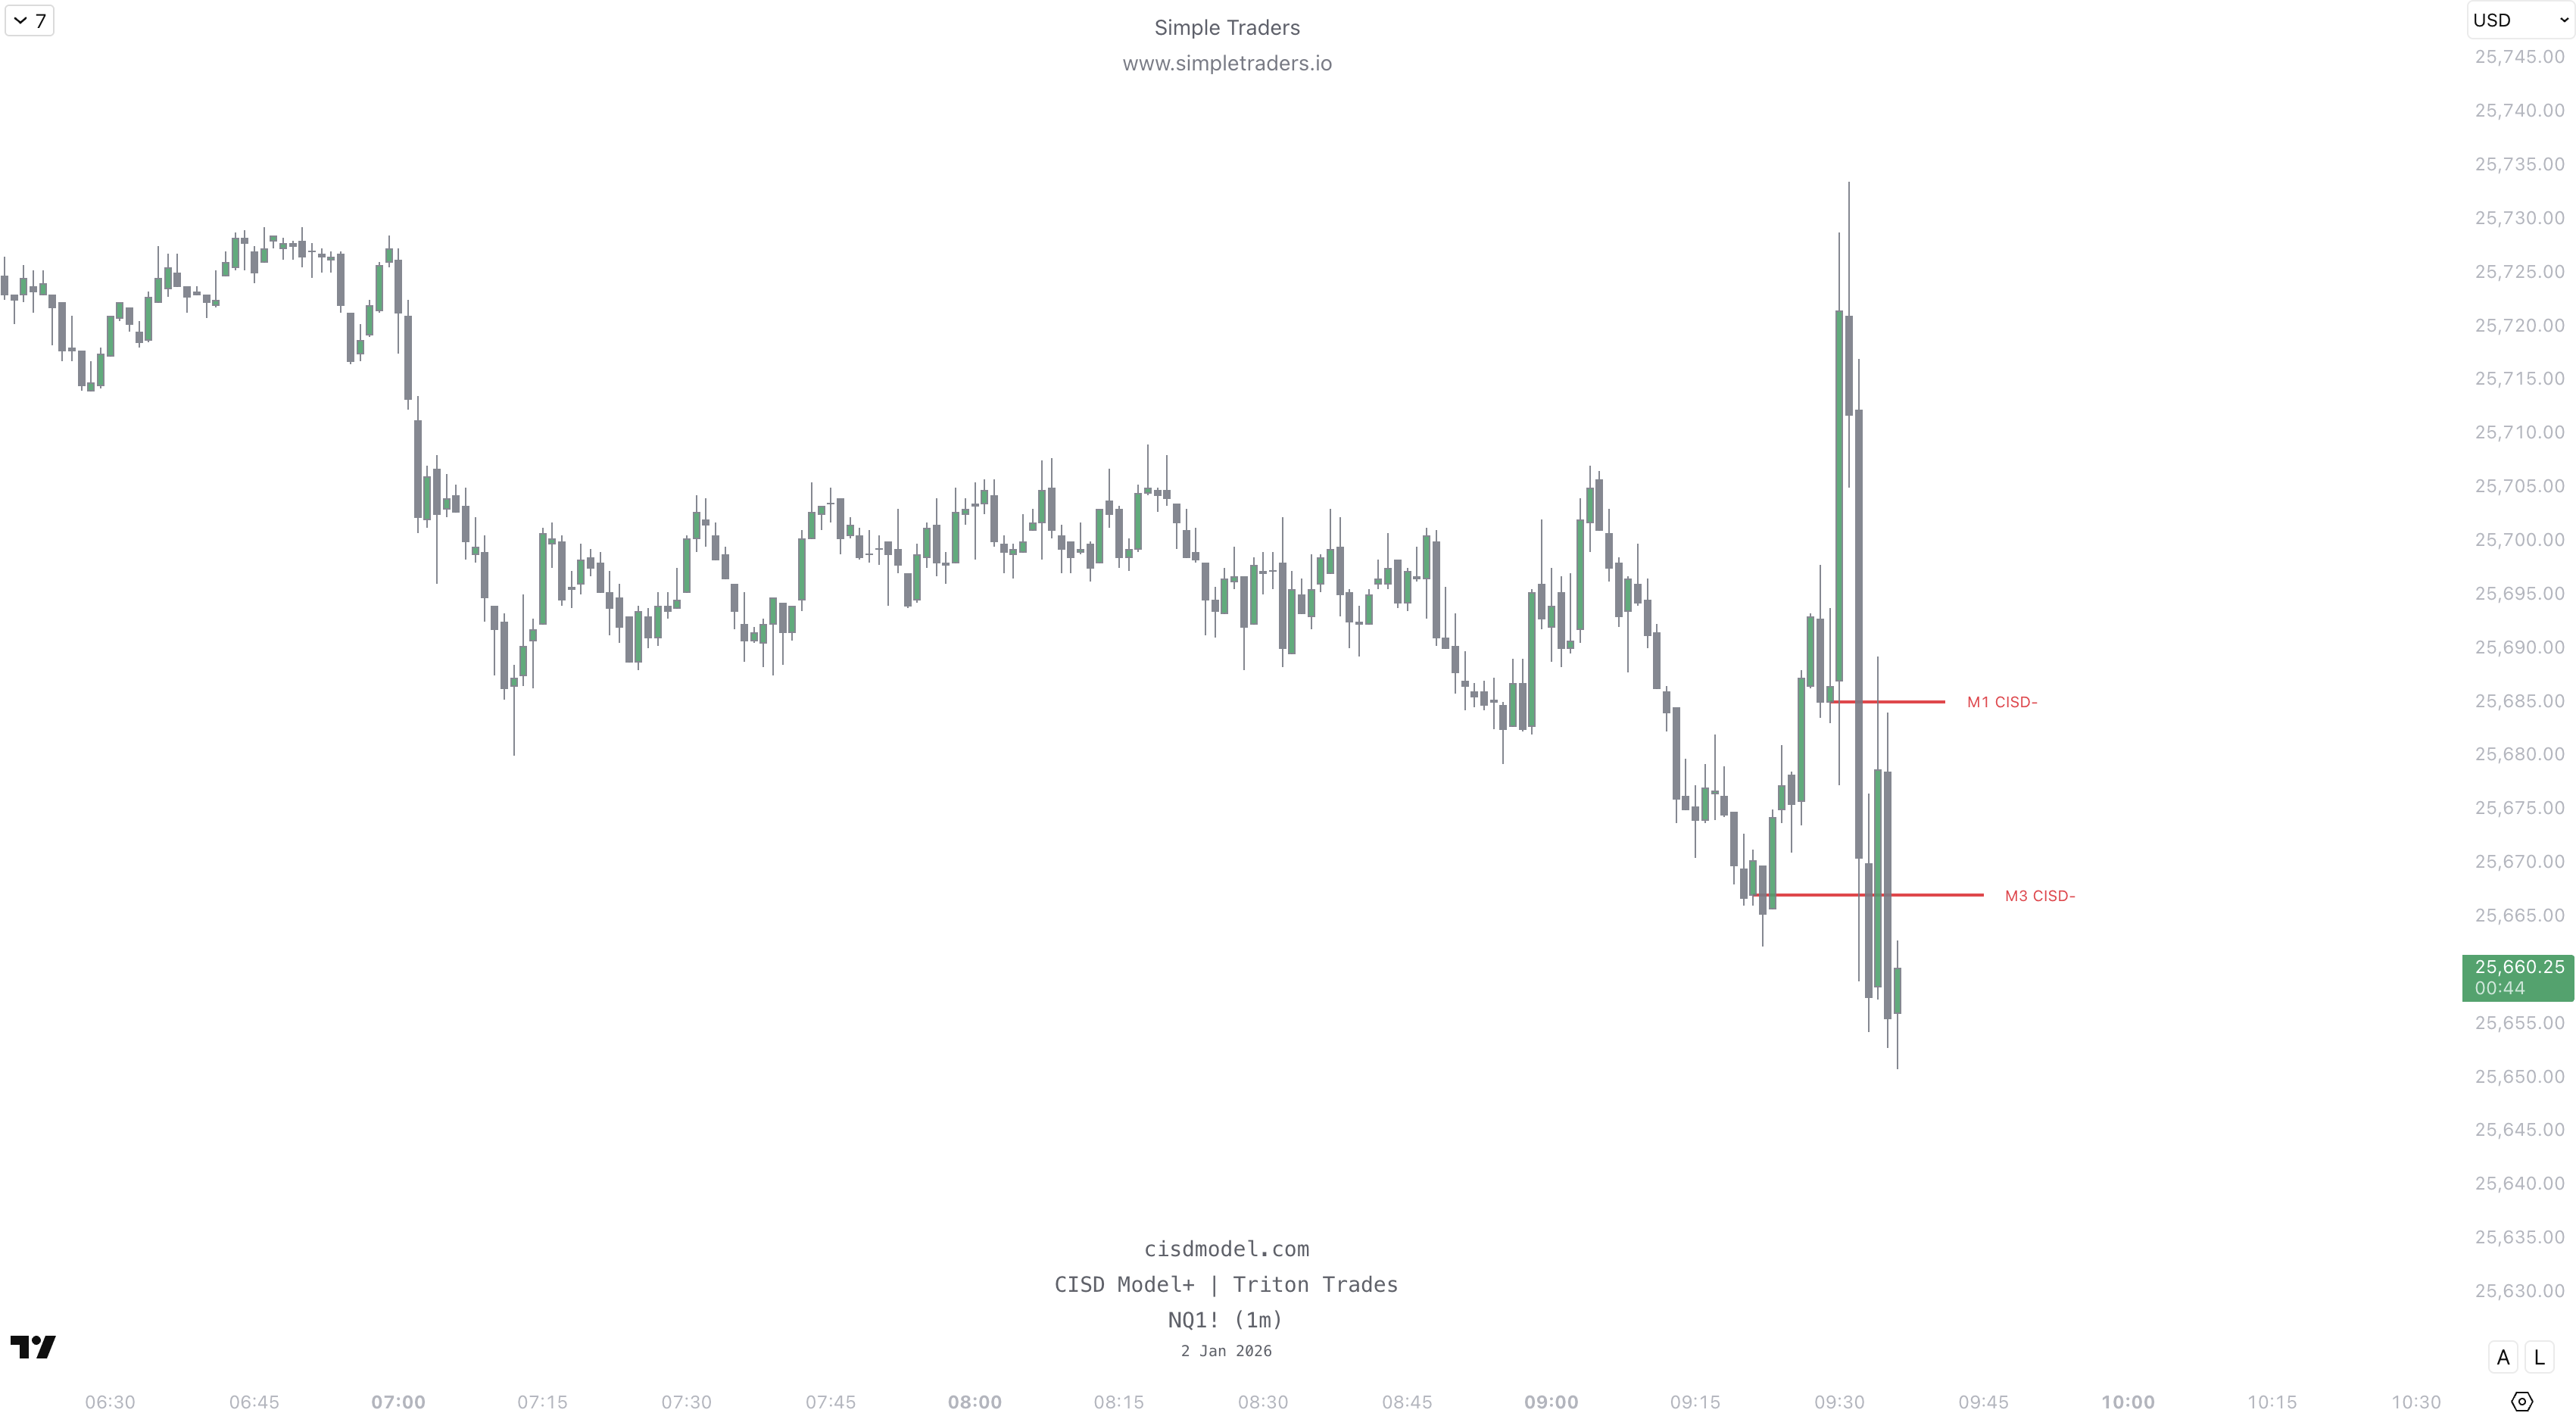
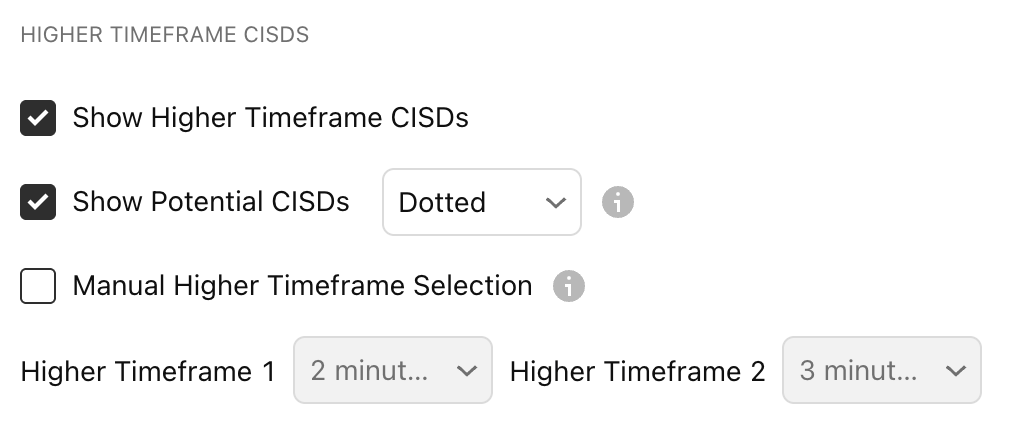
Show Higher Timeframe CISDs
Plots CISDs from higher timeframes once they have confirmed.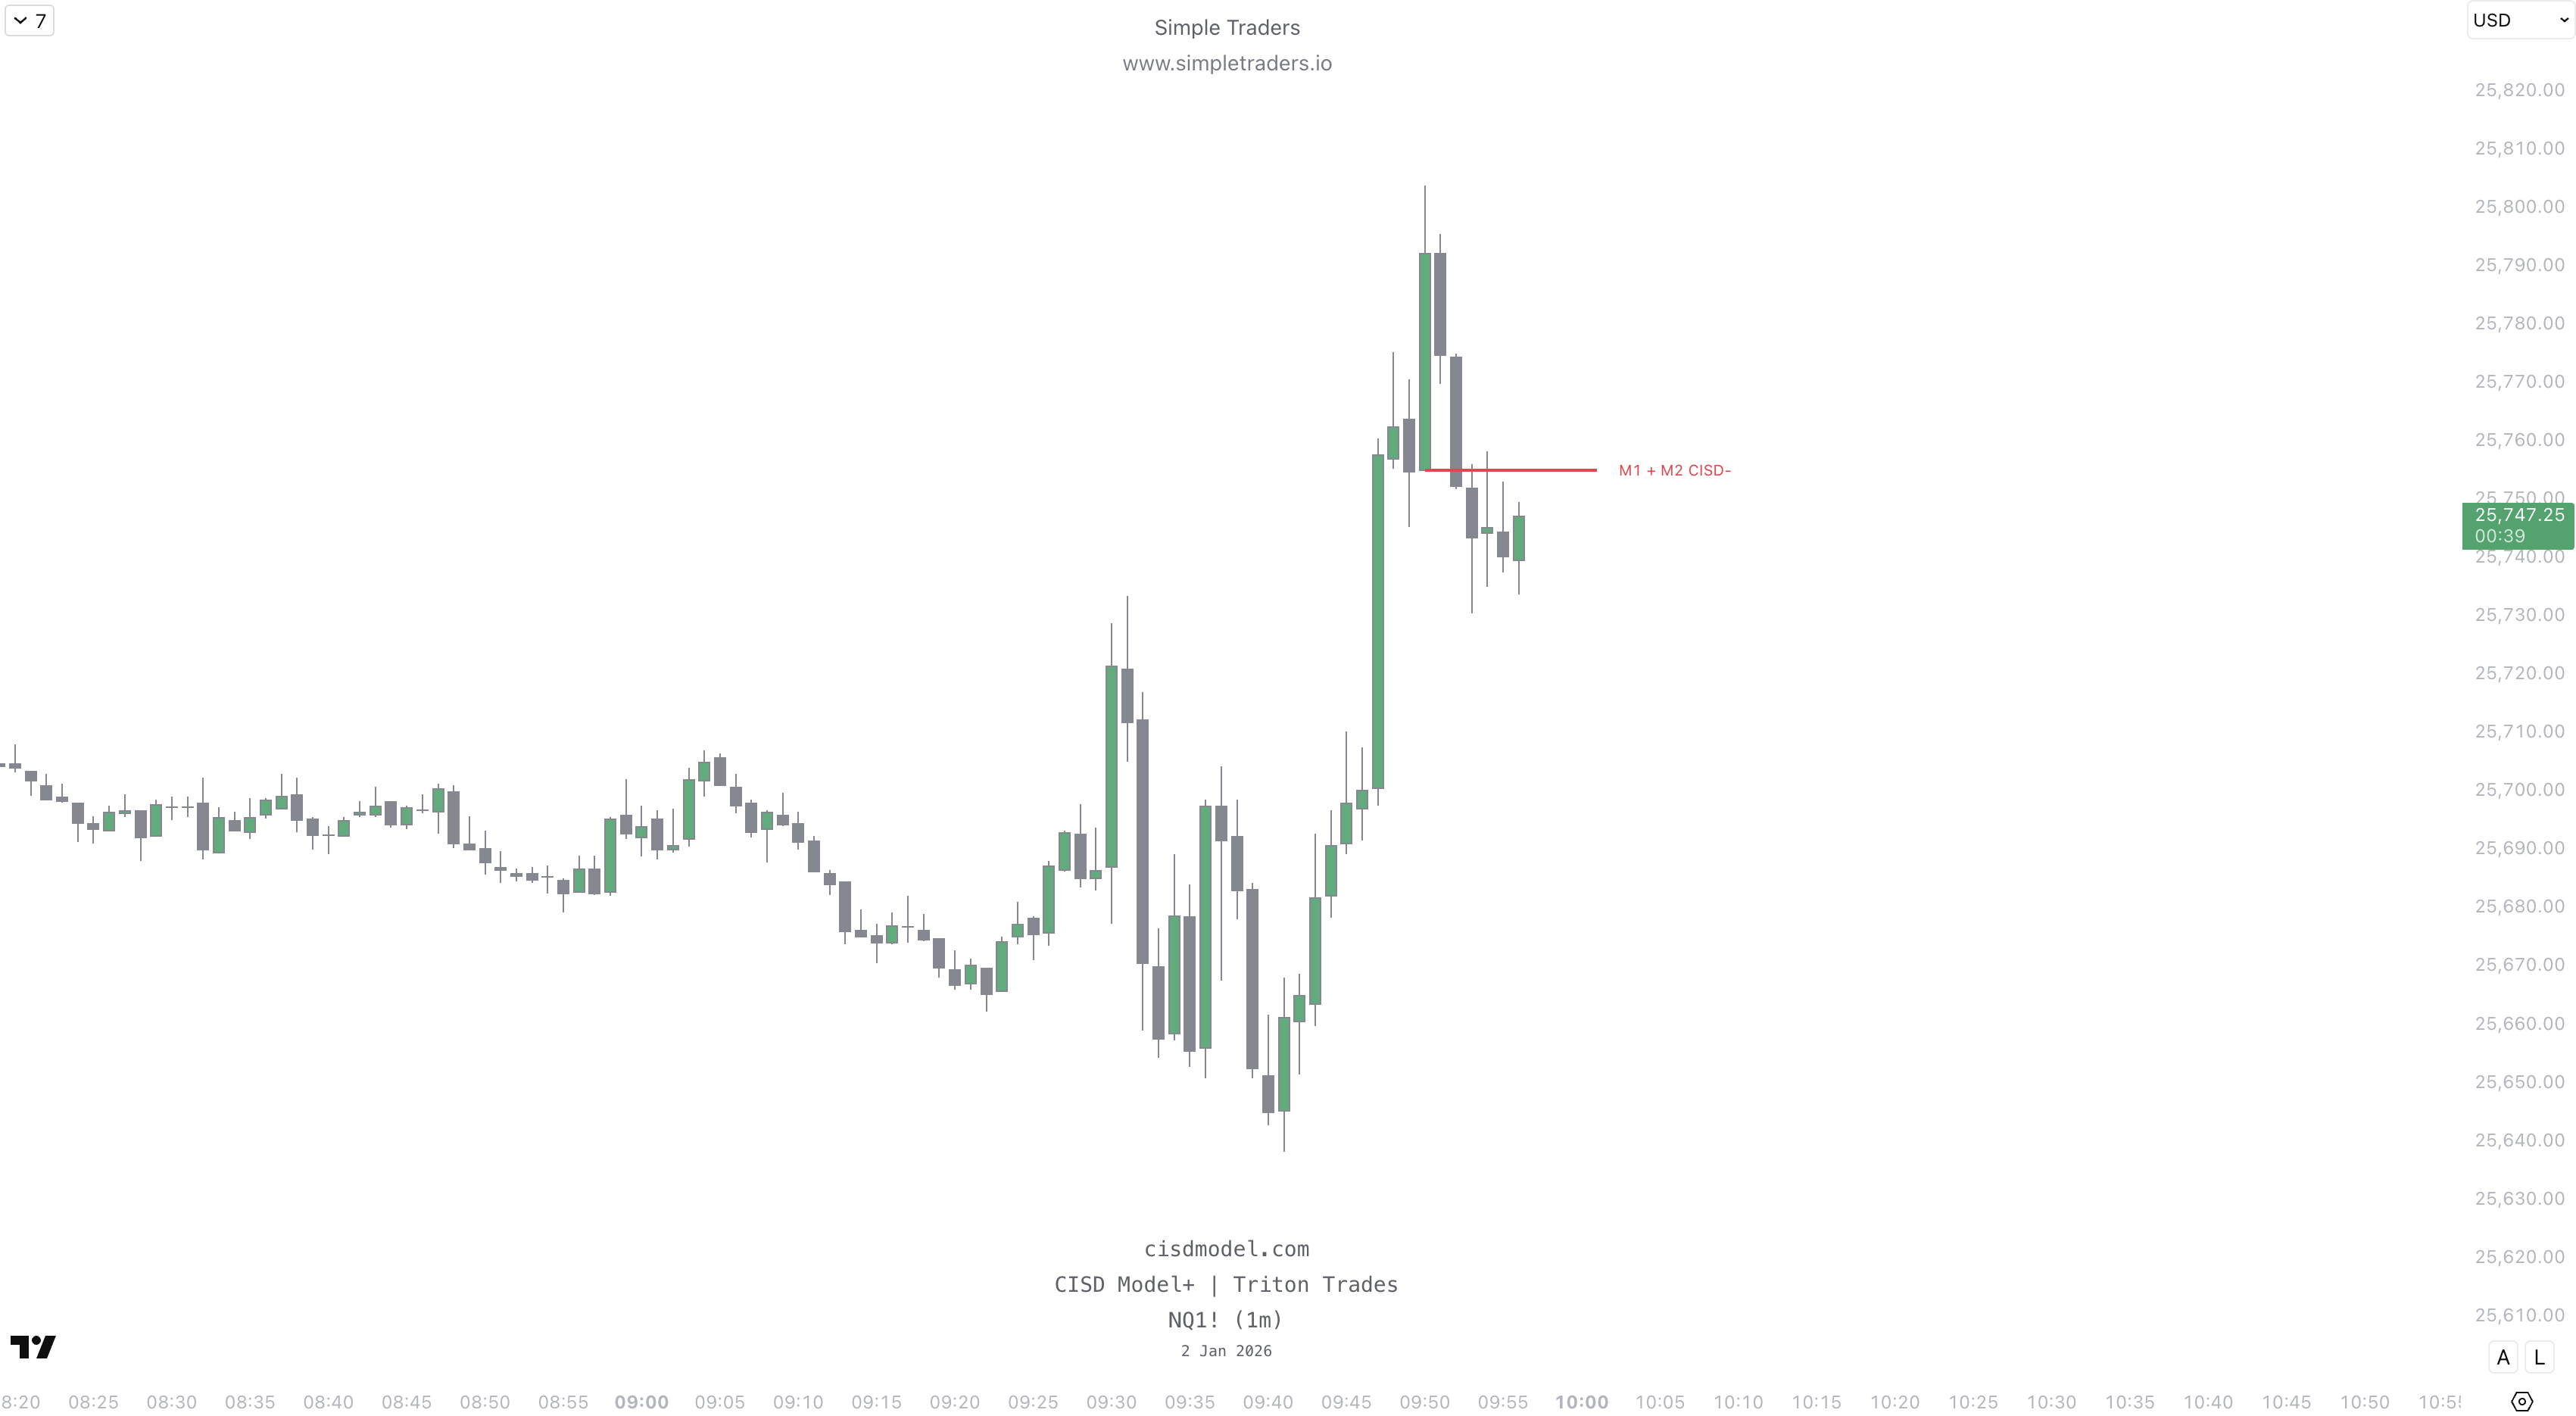
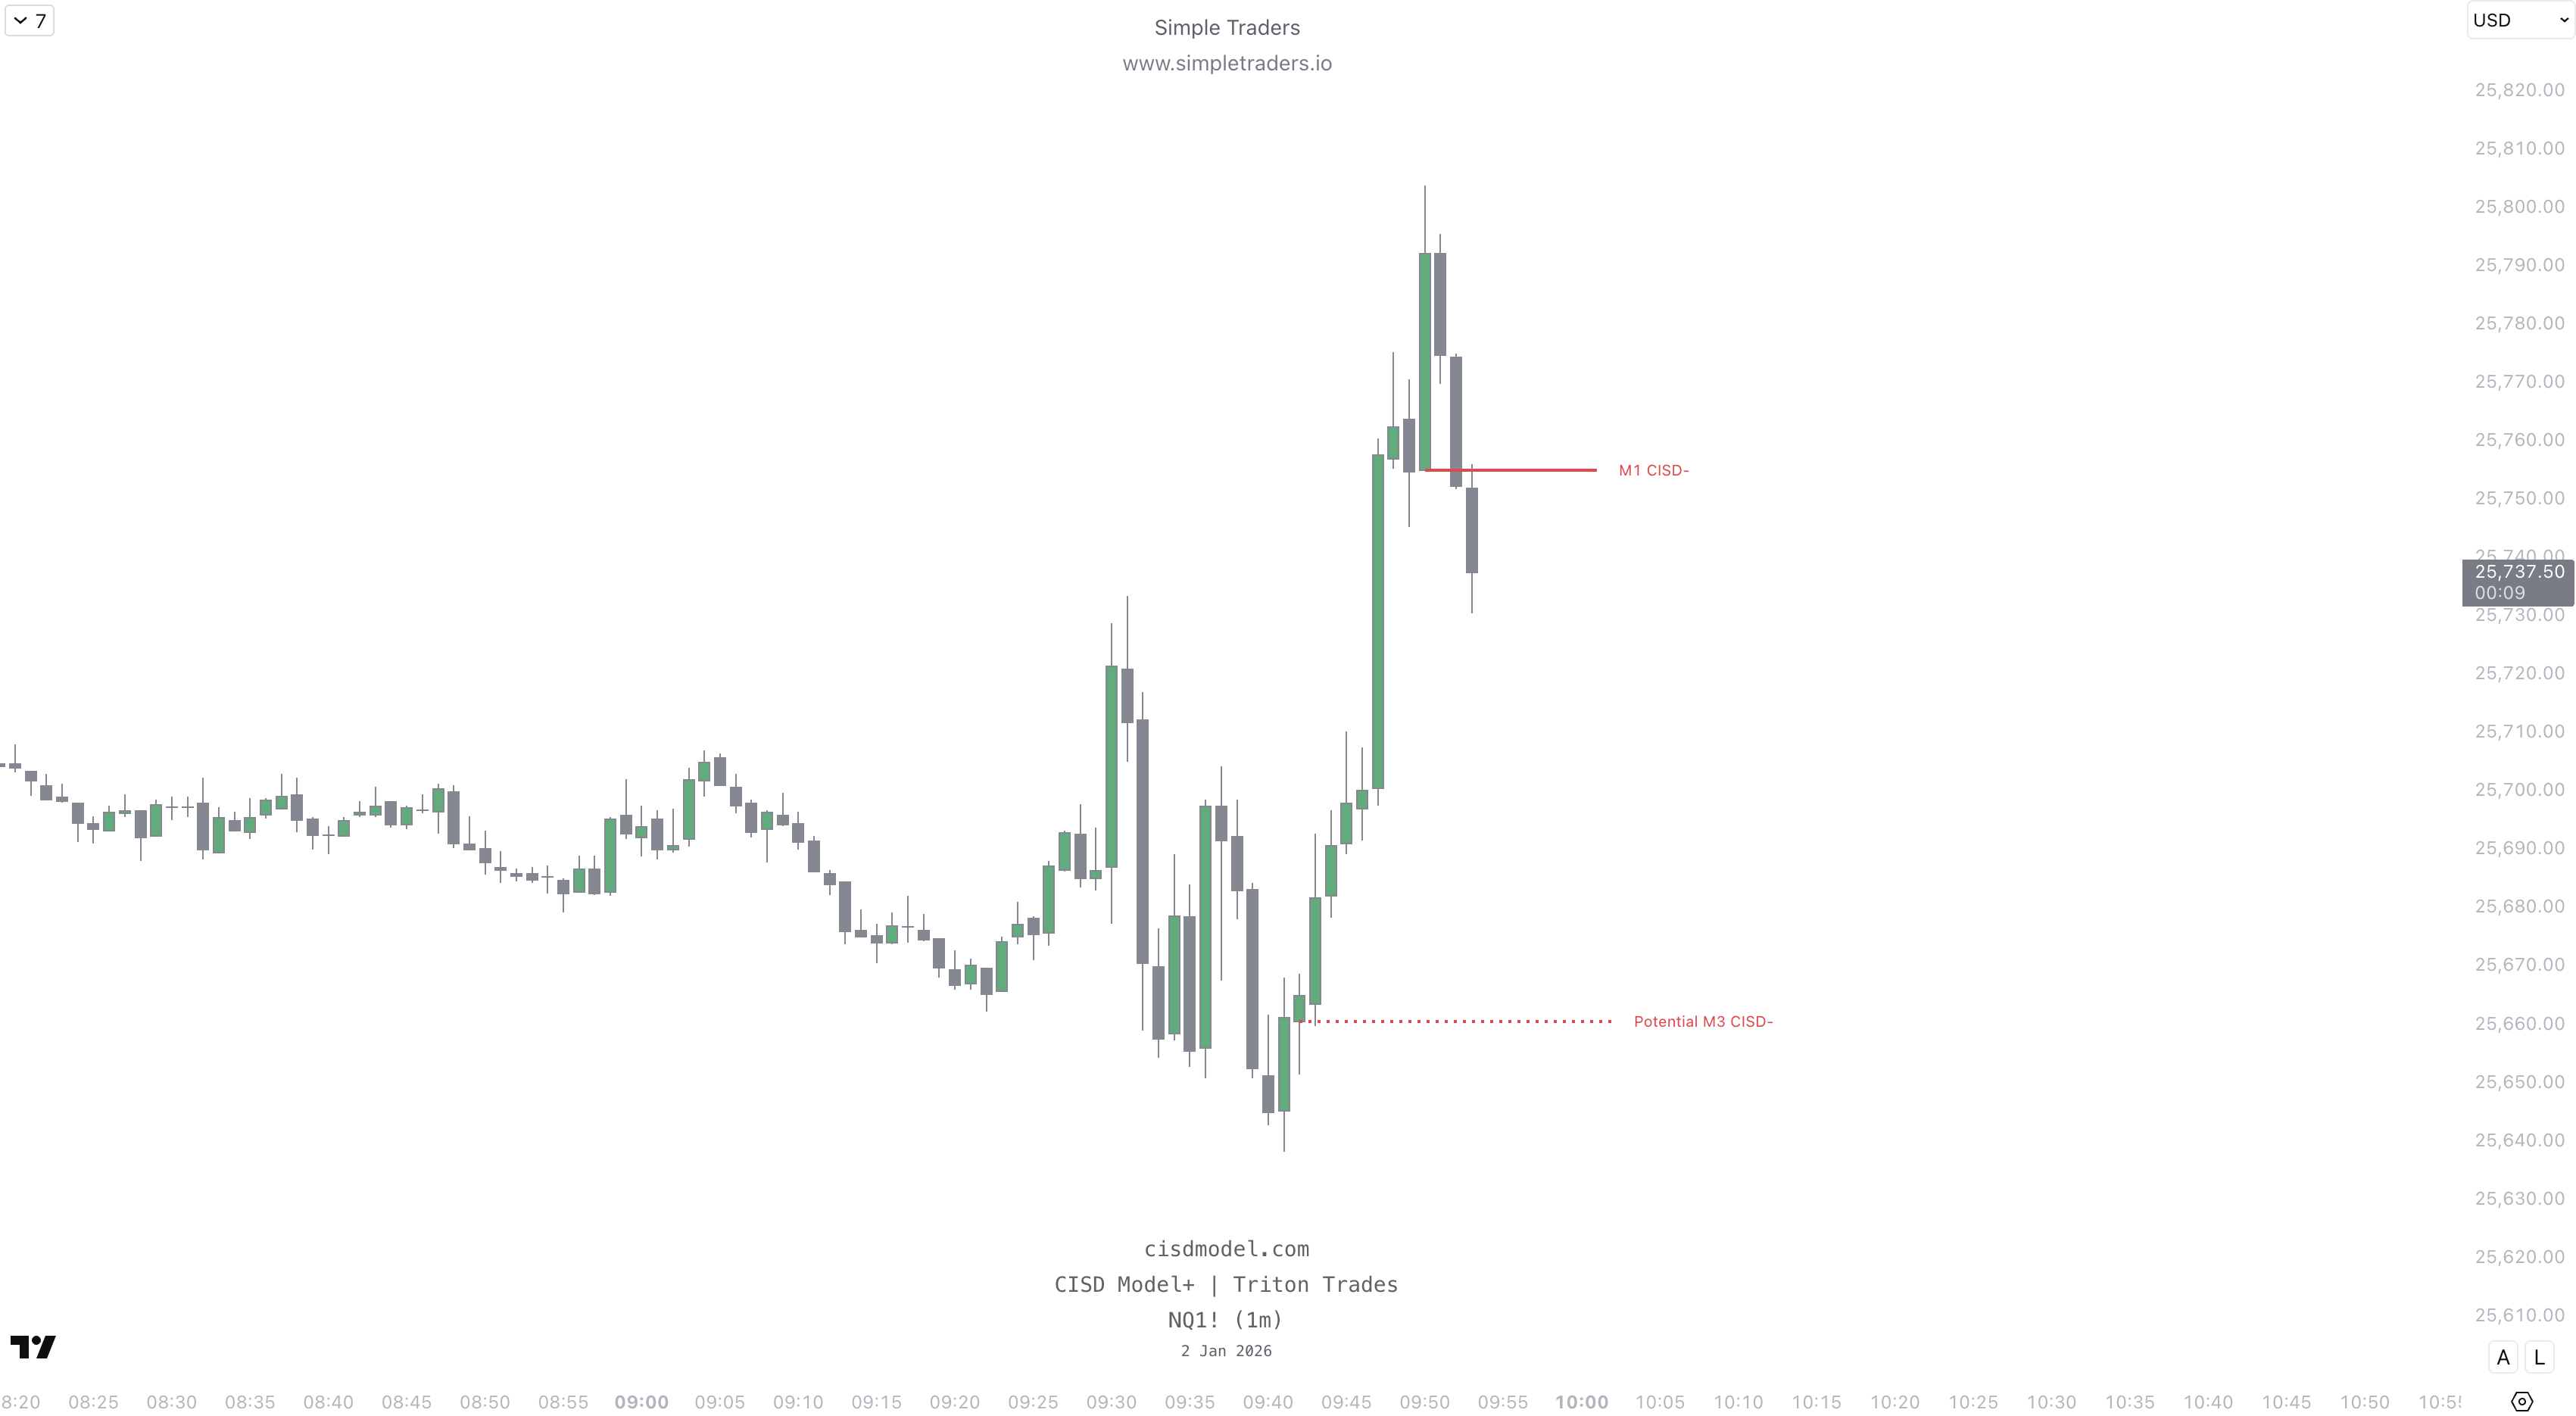
Show Potential CISDs
Plots CISDs from higher timeframes before they confirm. These CISDs will be labeled as “Potential CISD”, and will turn into a regular CISD once the CISD is confirmed.