
Feature Overview
Plots valid CISD levels on the chart. You can choose to only show bullish/bearish CISD by changing the “Bias” setting. CISD- is a bearish CISD, while CISD+ is a bullish CISD.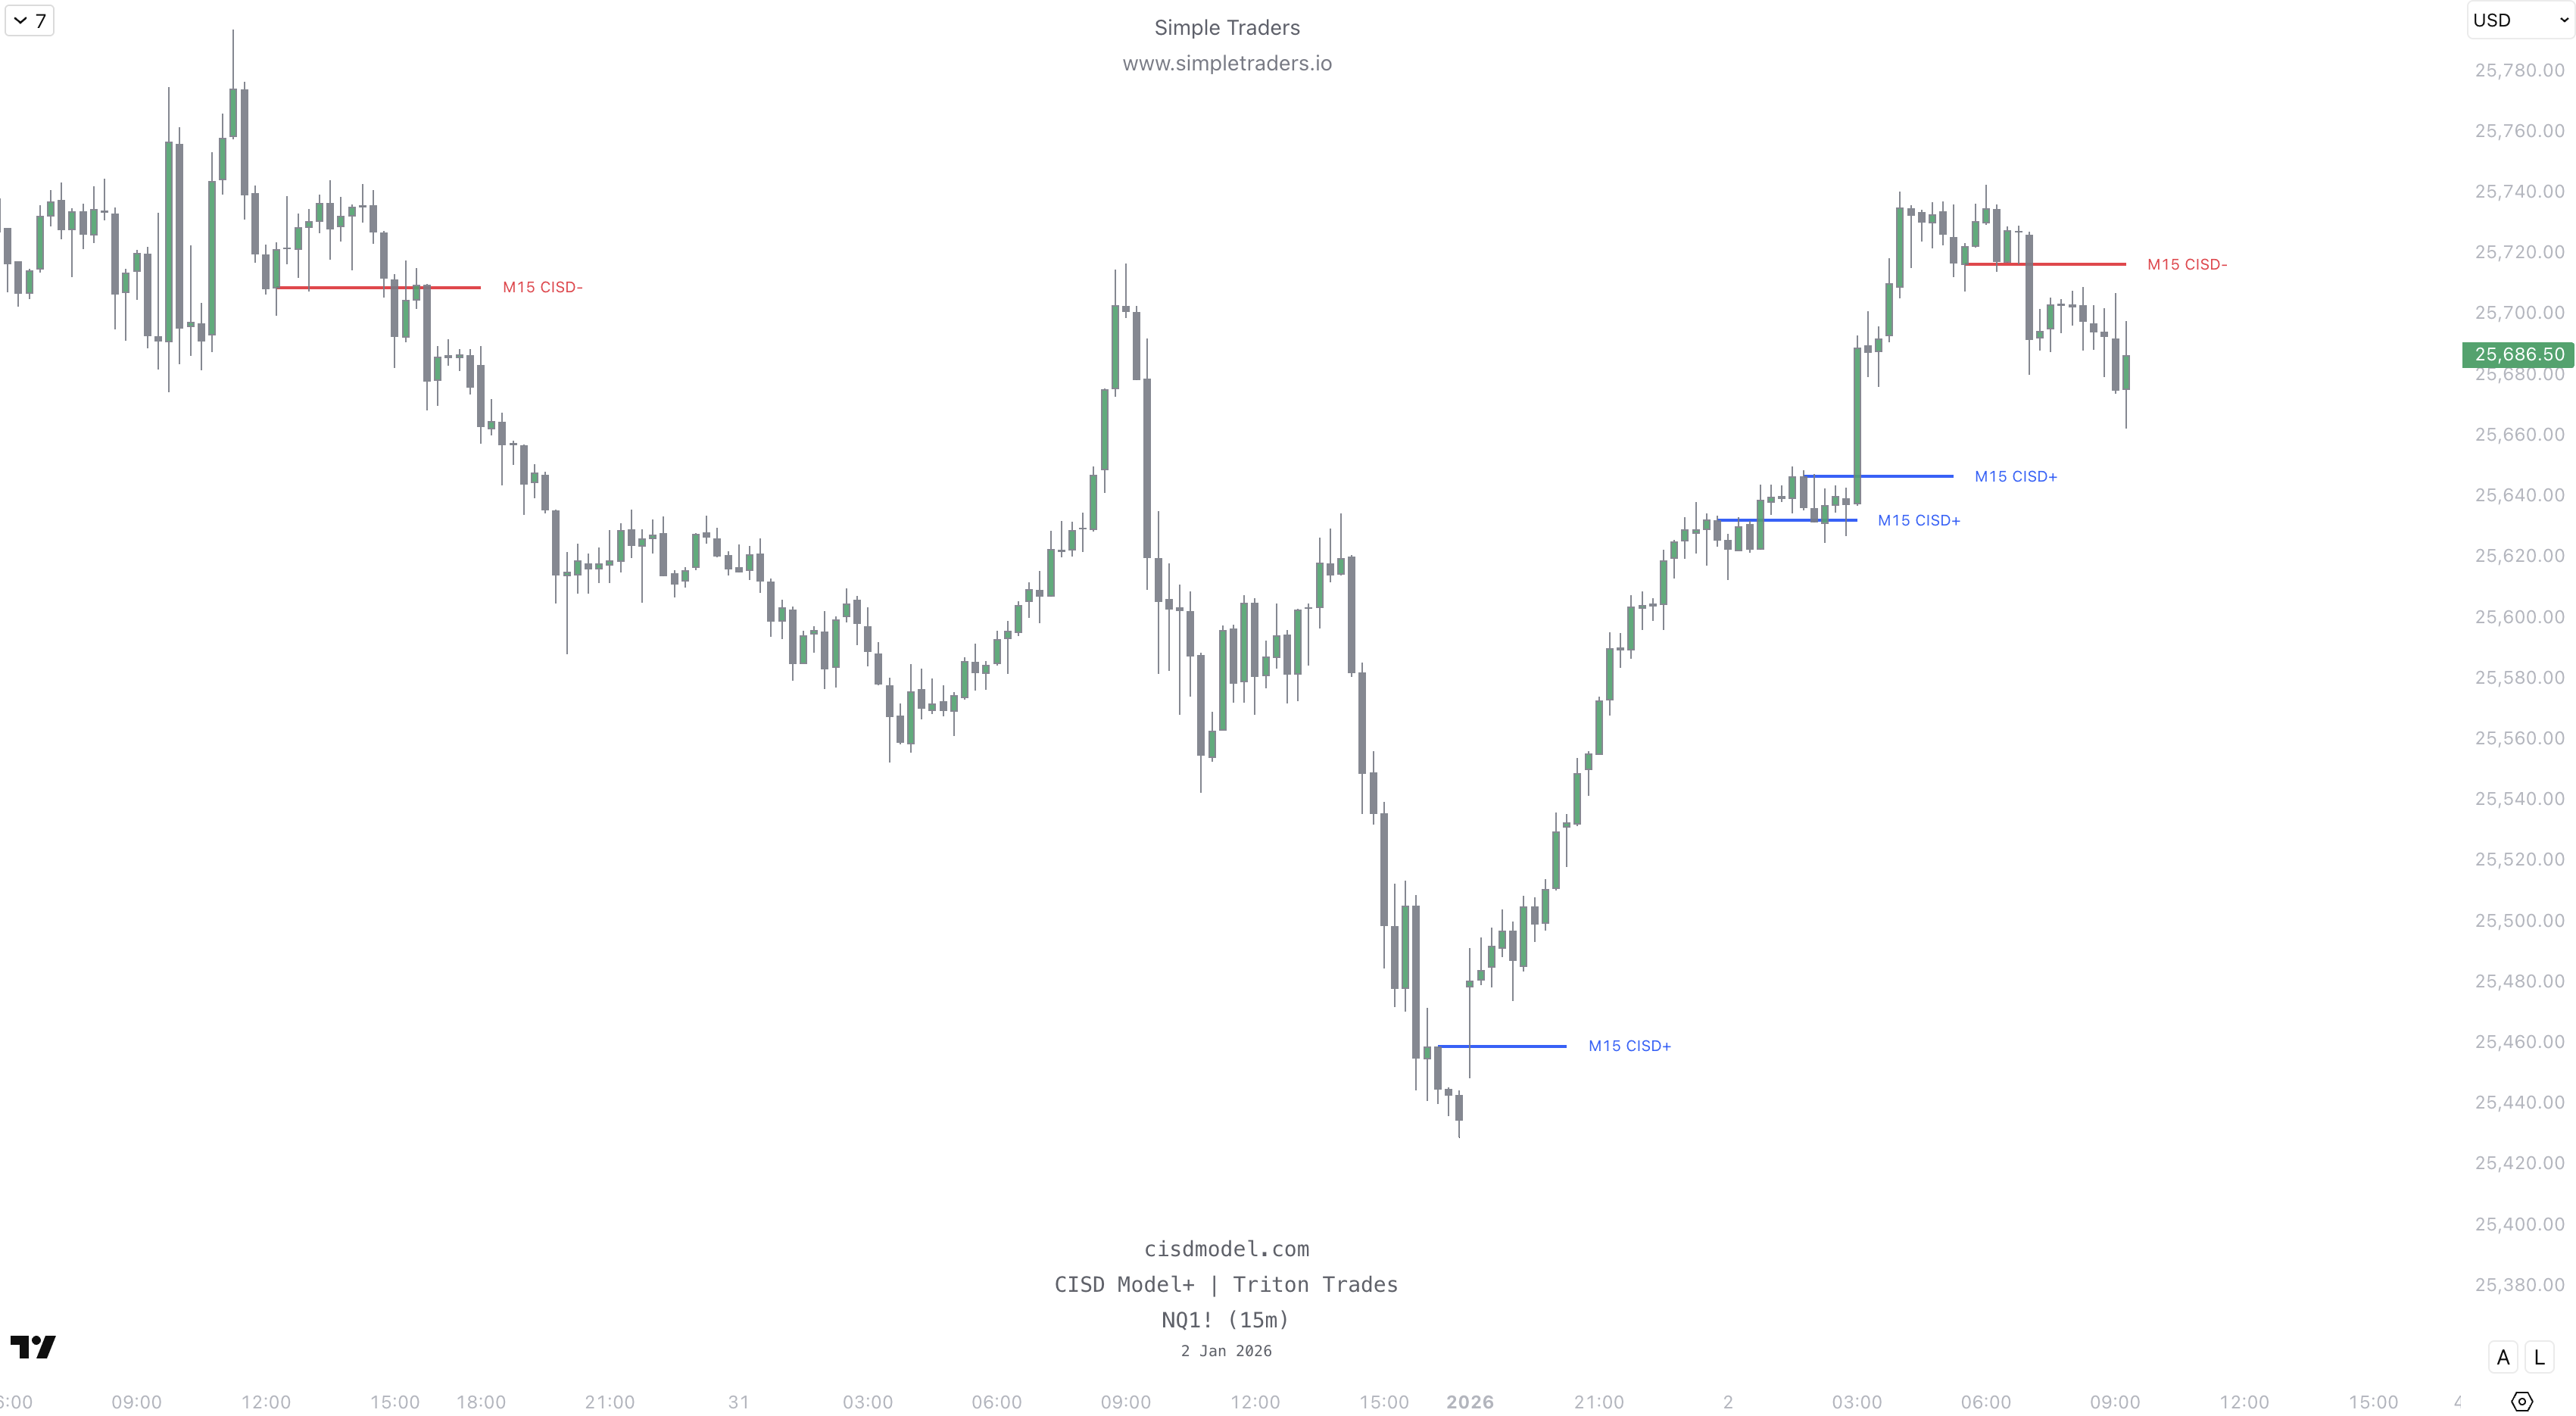
Show Potential Current TF CISDs
Marks a dotted “Potential CISD” line for CISDs that haven’t been confirmed.Once the CISD is confirmed by a candle close, the line will turn solid.
Disable Current TF Labels
Turn off the labels for the current timeframe CISDs for a cleaner look.HTF CISDs will still display a label regardless of this setting.
Detect CISDs from SMTs
This uses the SMT Cheatcode logic taught by Triton to detect a CISD from an SMT.We recommend keeping this setting ON to avoid missing potential CISD setups.
Customization
You can customize the color and opacity for both bullish and bearish CISDs.You can also change the label size.
The label follows the one set for the CISD line.