
Bias
- Neutral: The indicator will show both Bearish and Bullish setups.
- Bullish: The indicator will only show Bullish setups.
- Bearish: The indicator will only show Bearish setups.
Hide Invalidated Setups
It’s best to turn ON to avoid cluttering your chart with old invalid setups.
Number of Setups Displayed:
This shows the total number of CISD lines displayed. The example below displays 5 setups. As you can see, 5 valid CISD lines are plotted.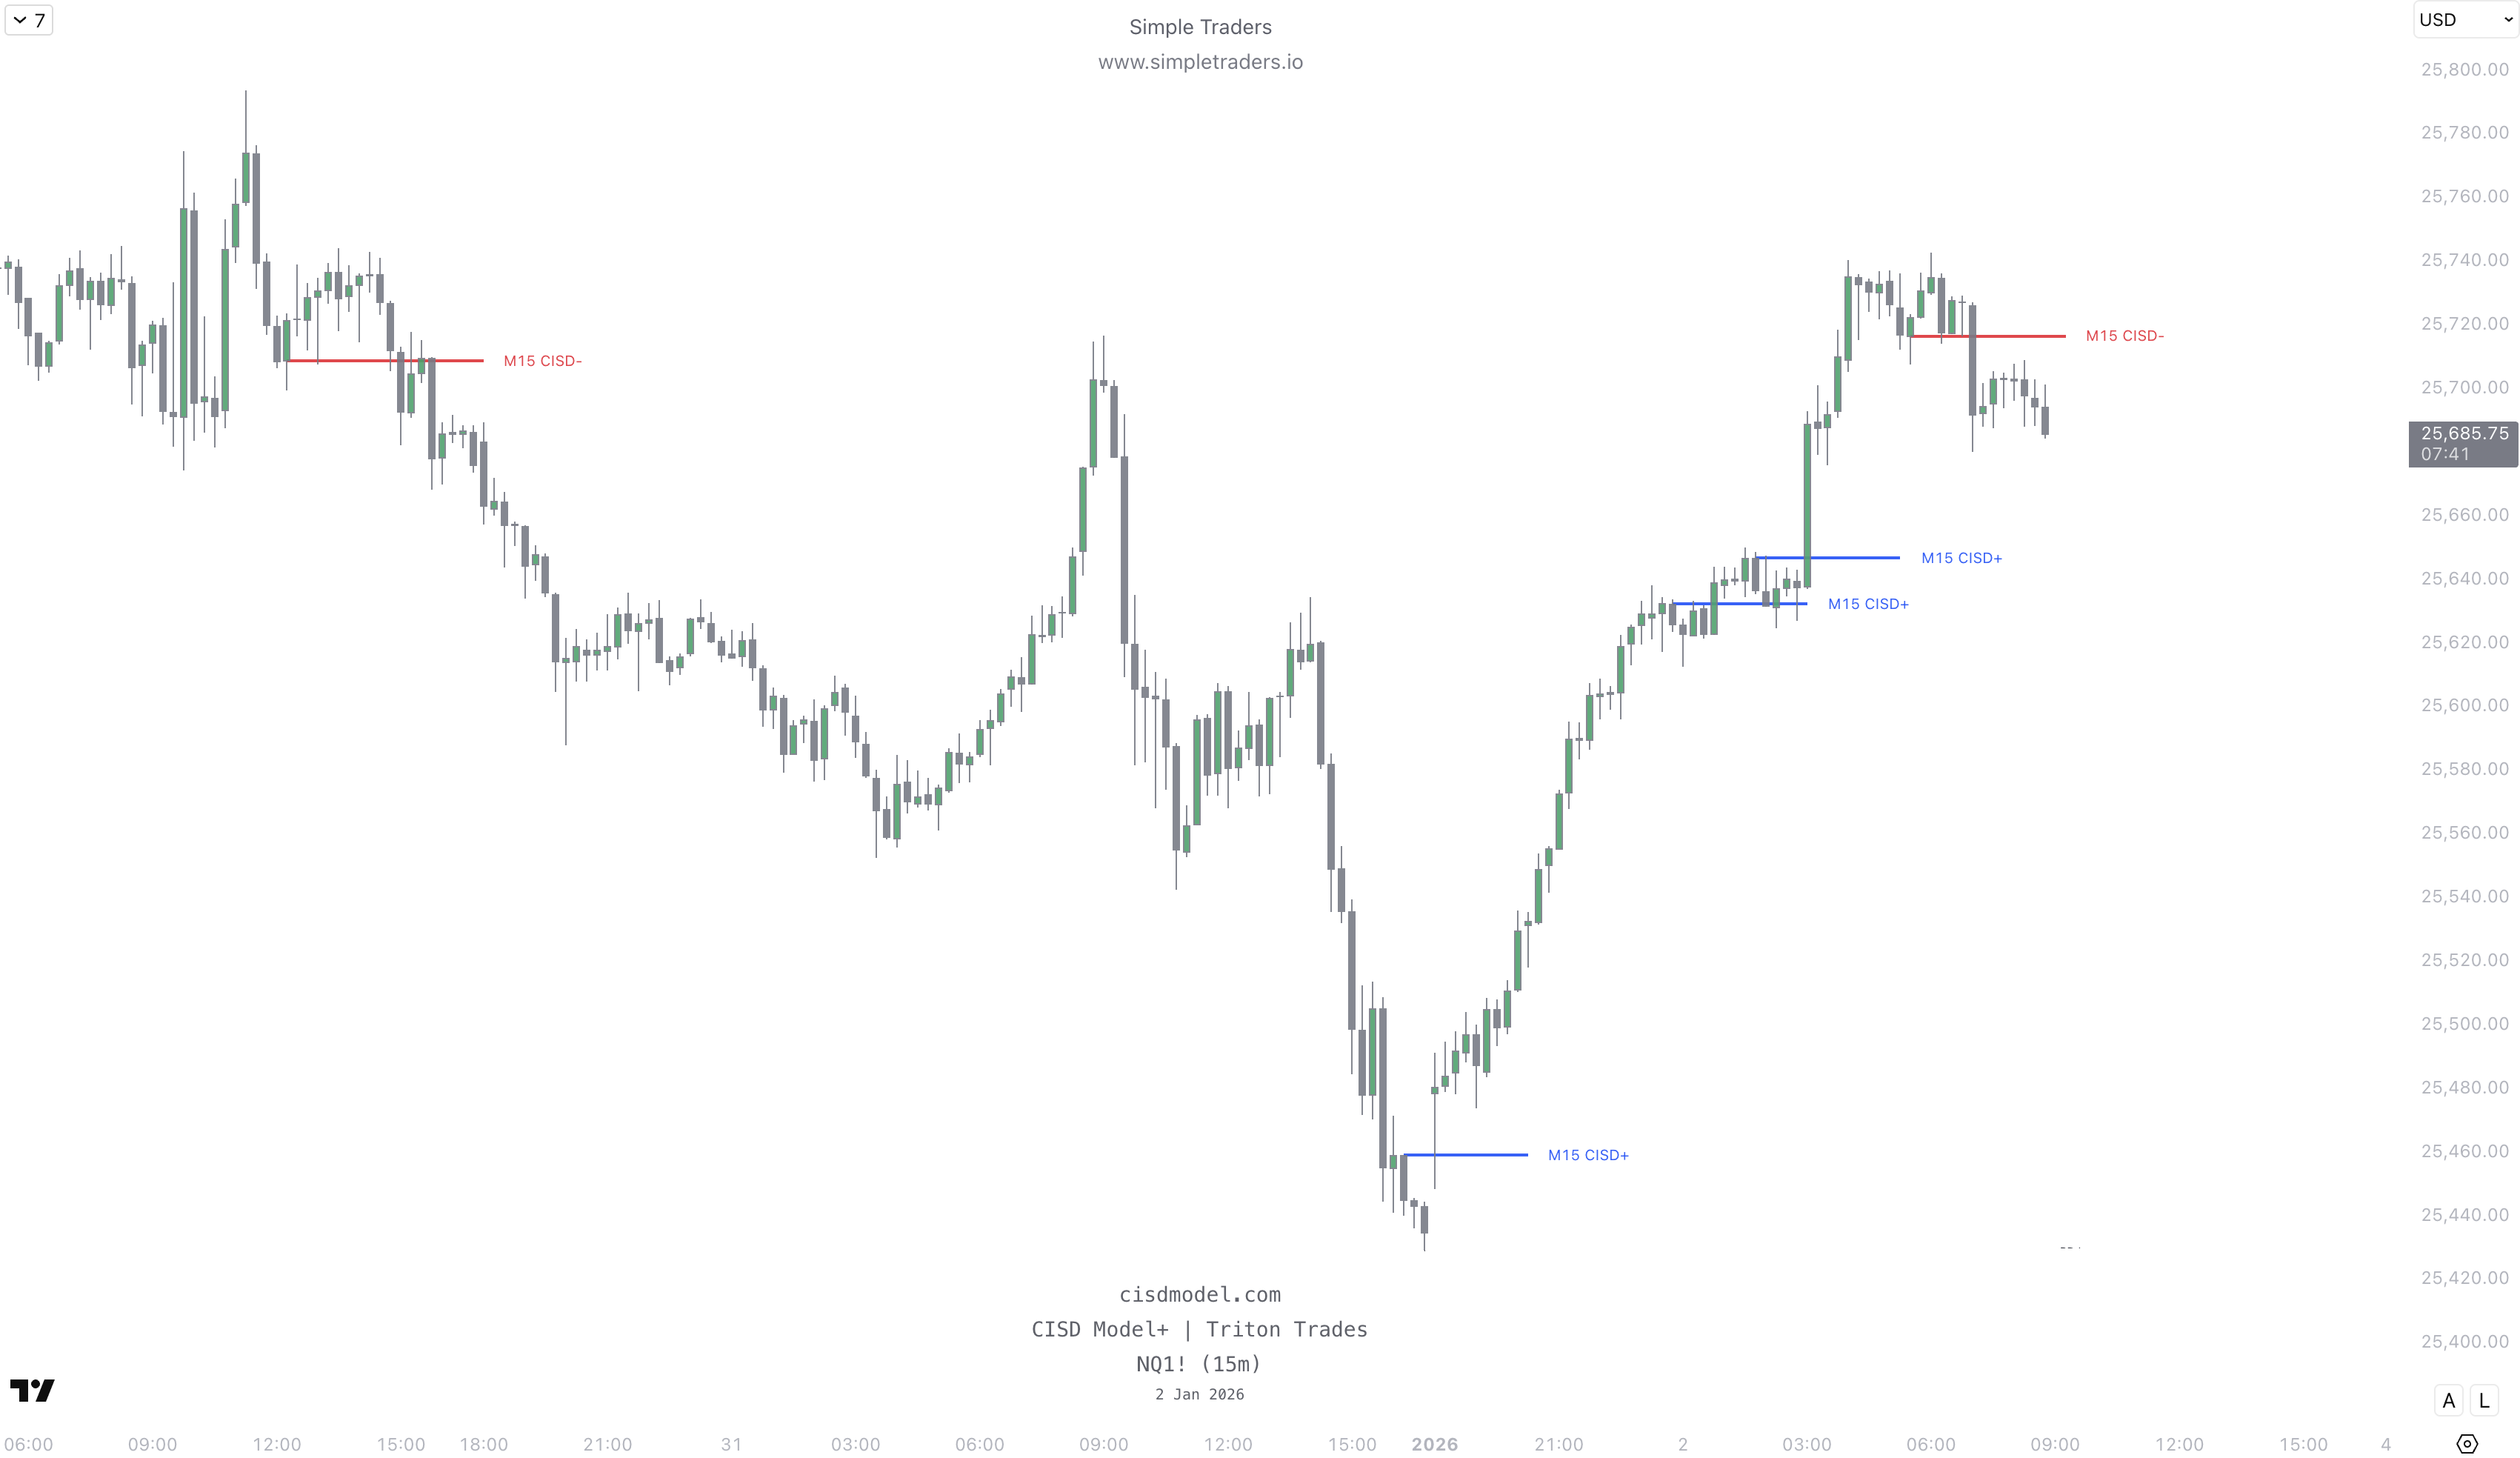
Current Timeframe FVG Delivery
This will mark out the FVGs on the current chart timeframe.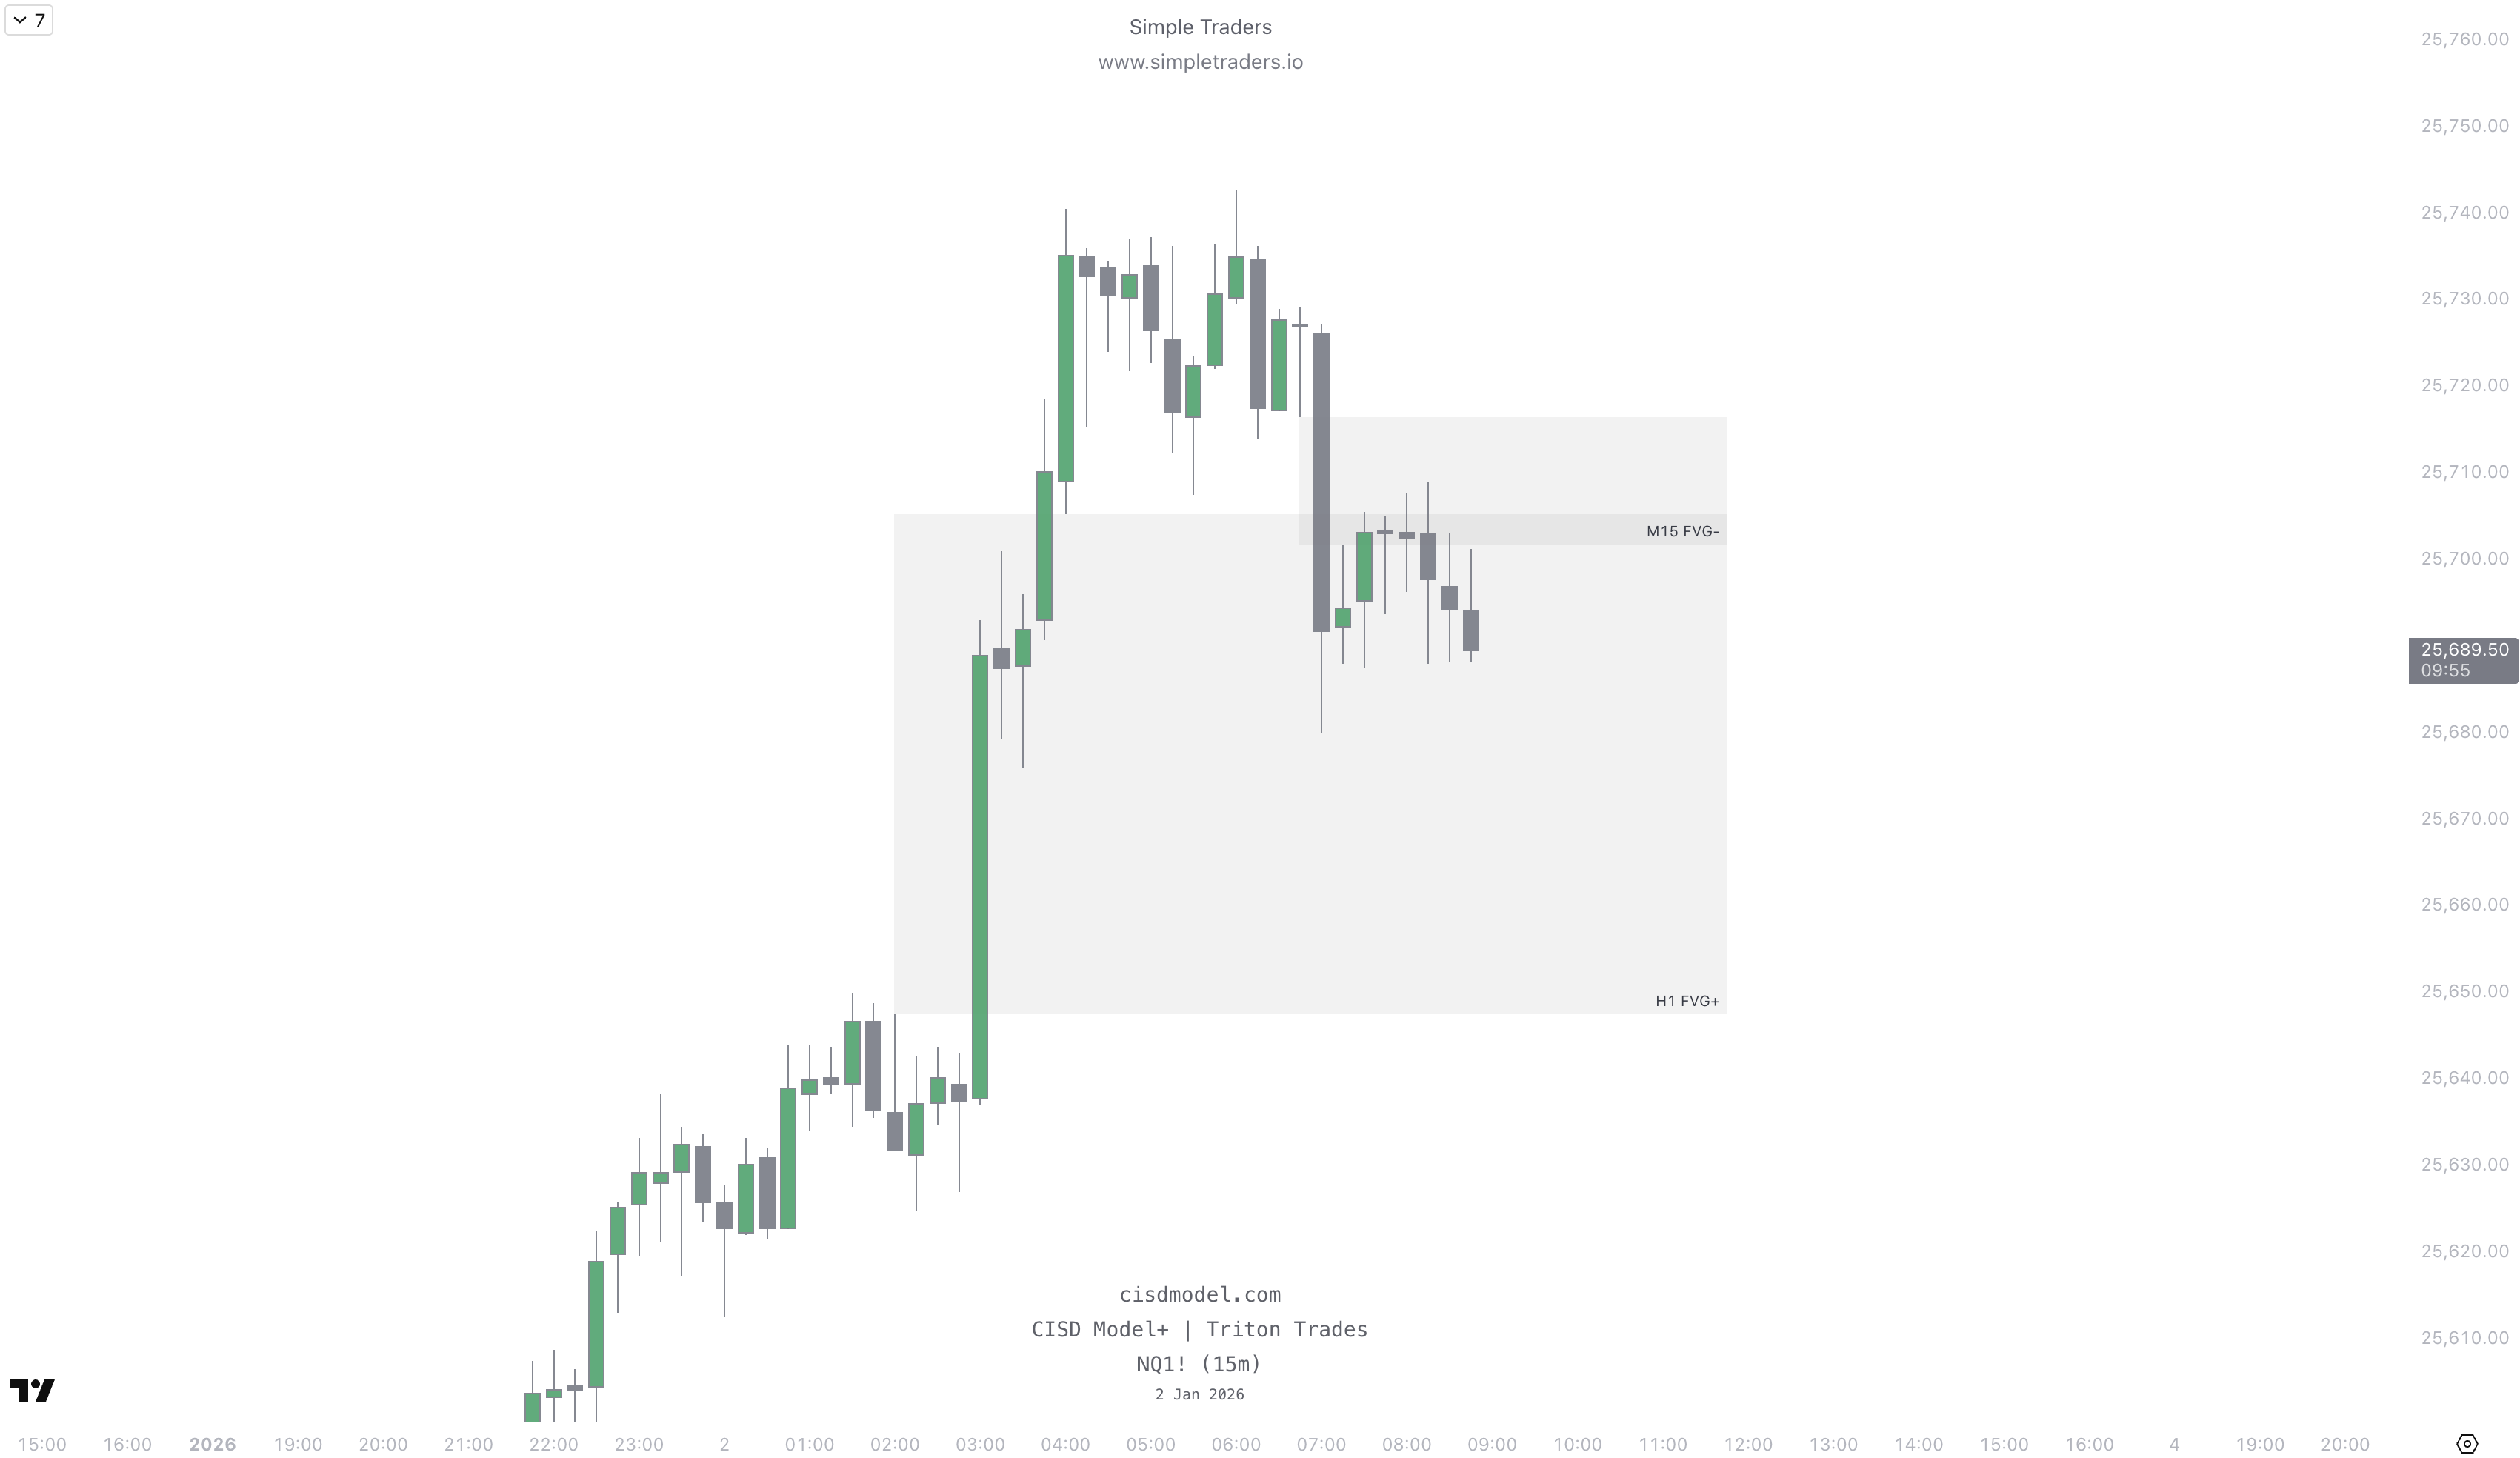
Current Timeframe Liquidity Sweeps
This will also detect liquidity sweeps on the current timeframe.We recommend keeping this setting ON.
Ignore Close Proximity CISDs
This will prevent multiple CISDs that are very close to each other from being shown.It’s recommended to turn this ON to avoid clutter.