
Feature Overview
Plots out Fair Value Gaps (FVGs) from higher timeframes relative to the current chart timeframe. It will only show the most relevant FVGs at any given time to reduce clutter.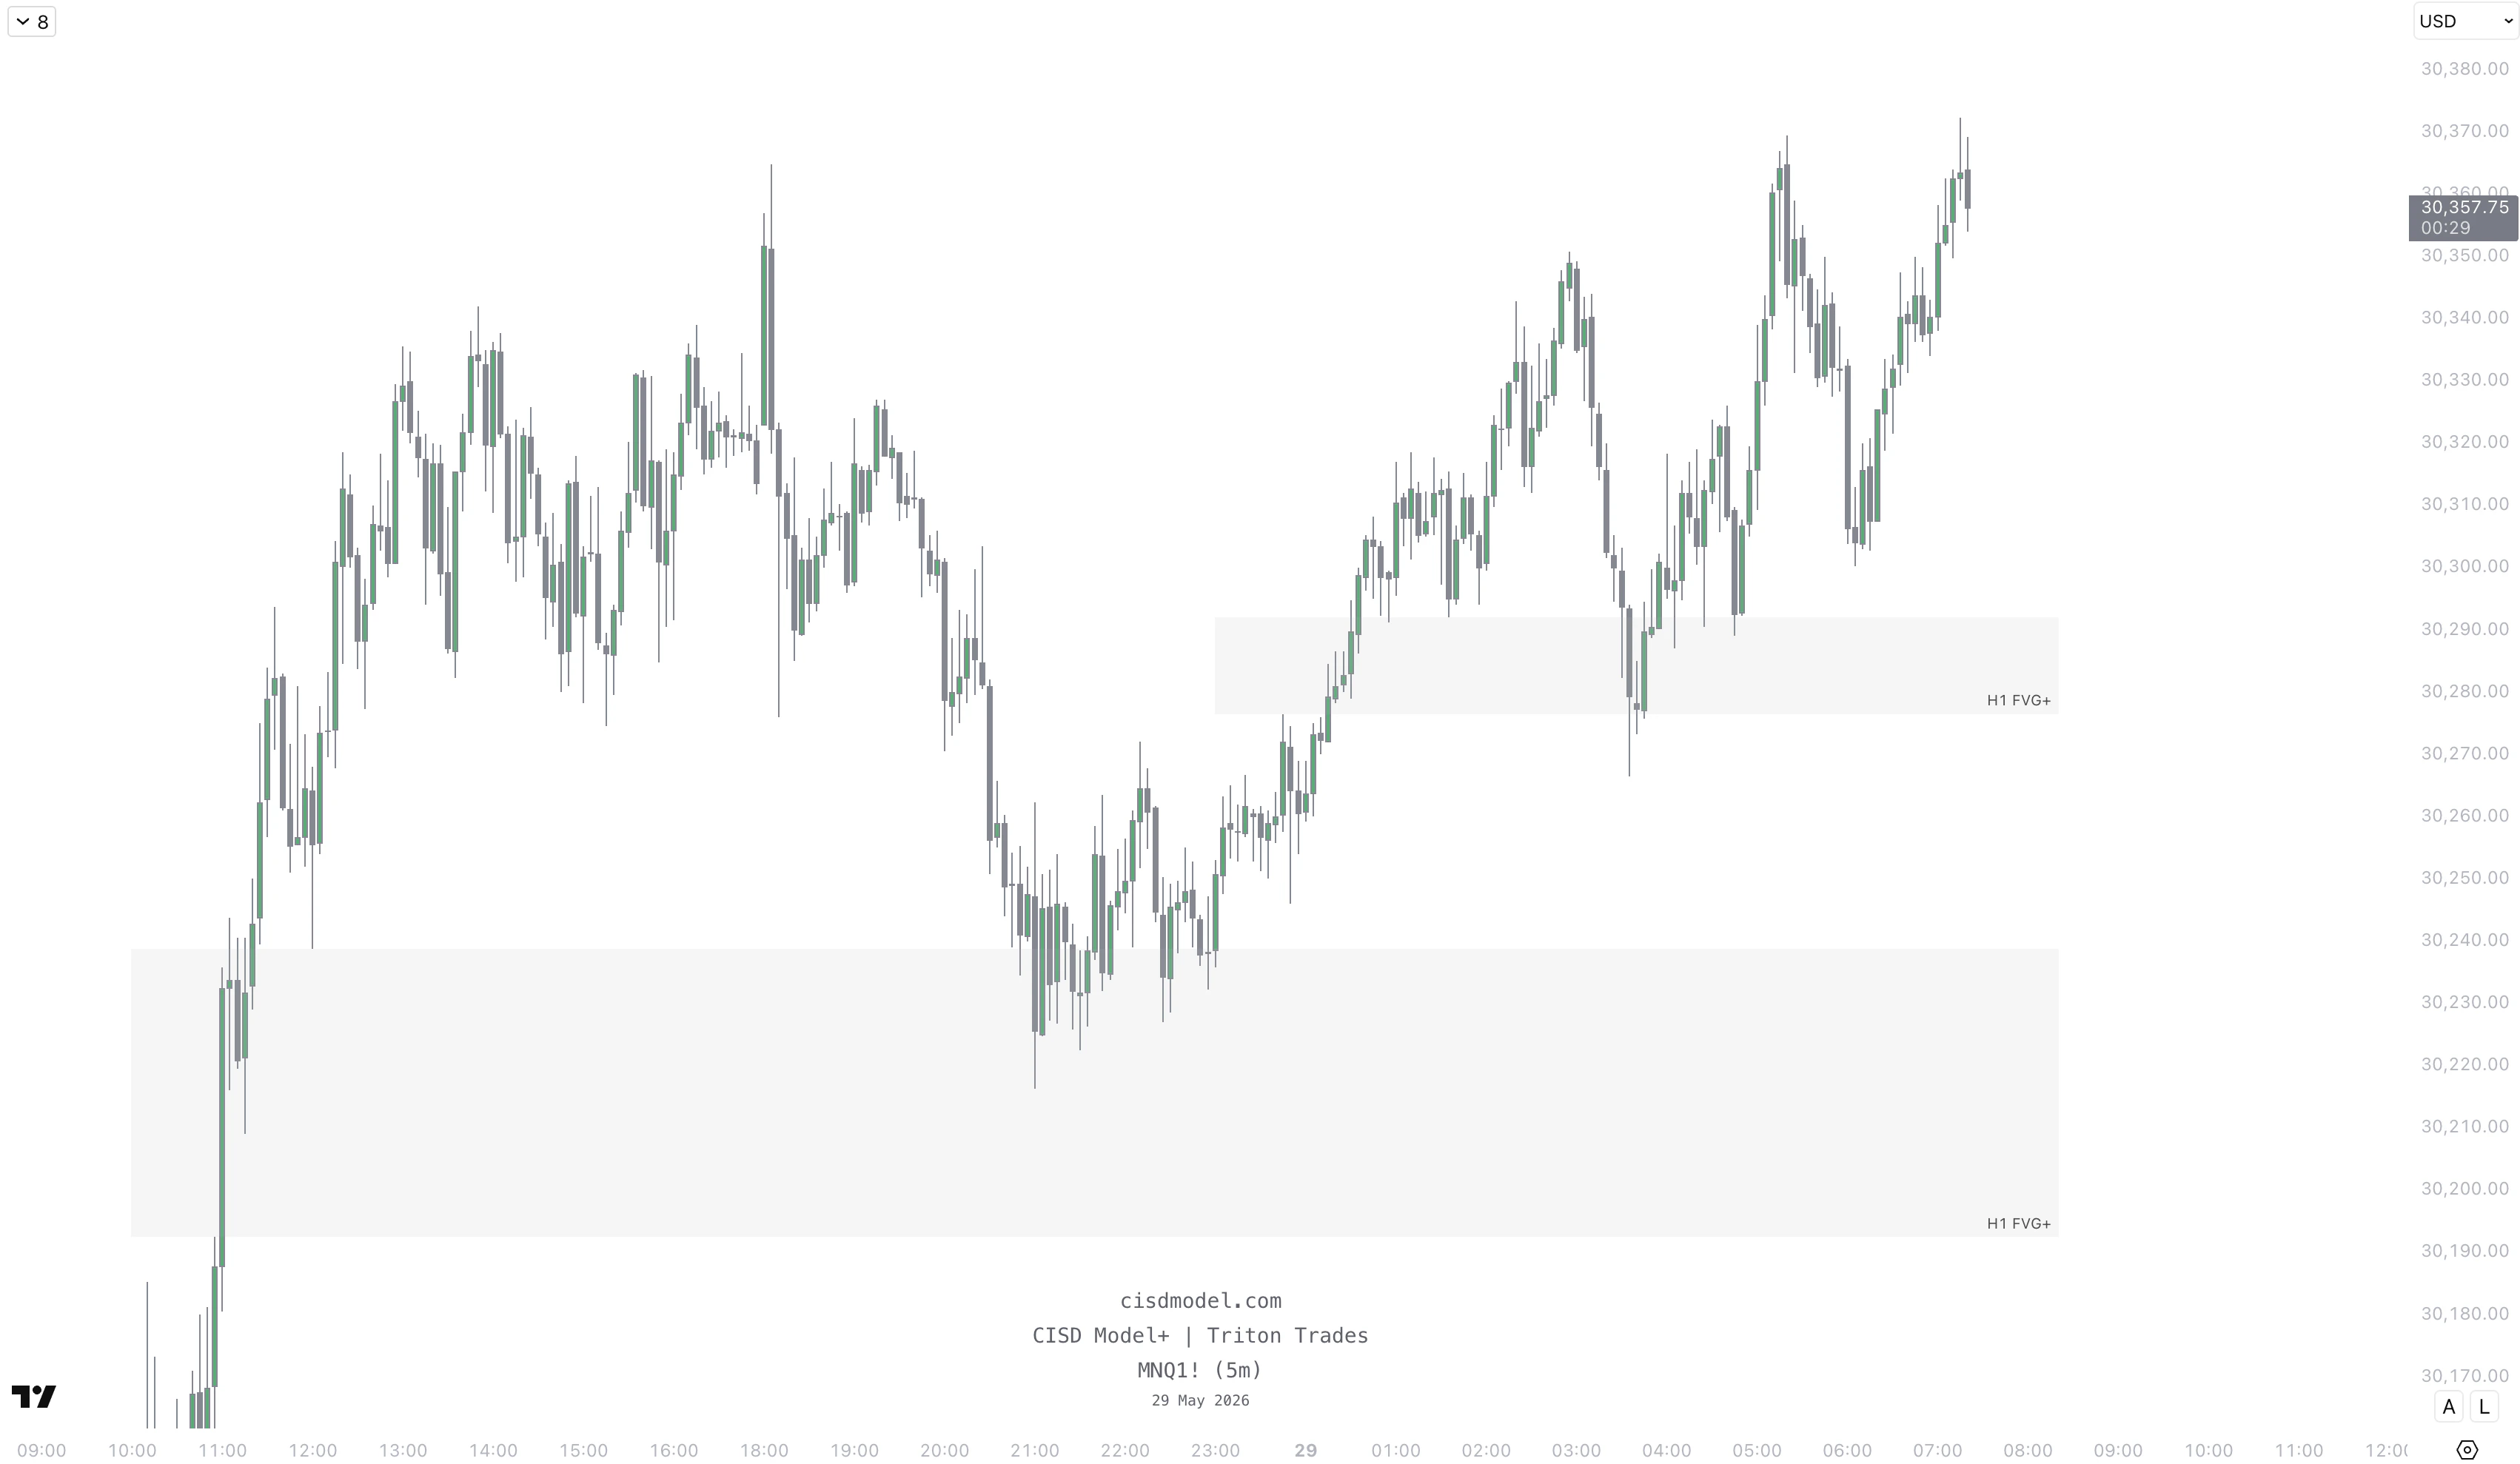
HTF Timeframe Mode
Automatic - it’ll use timeframe alignment to choose the relevant HTF for FVGse.g., if you’re on the 1-minute chart, it’ll pull FVGs from the 15-minute and 1-hour charts. Manual - you can manually select the HTF timeframe for FVGs