> ## Documentation Index
> Fetch the complete documentation index at: https://docs.cisdmodel.com/llms.txt
> Use this file to discover all available pages before exploring further.
# Session Liquidity
 ### Feature Overview
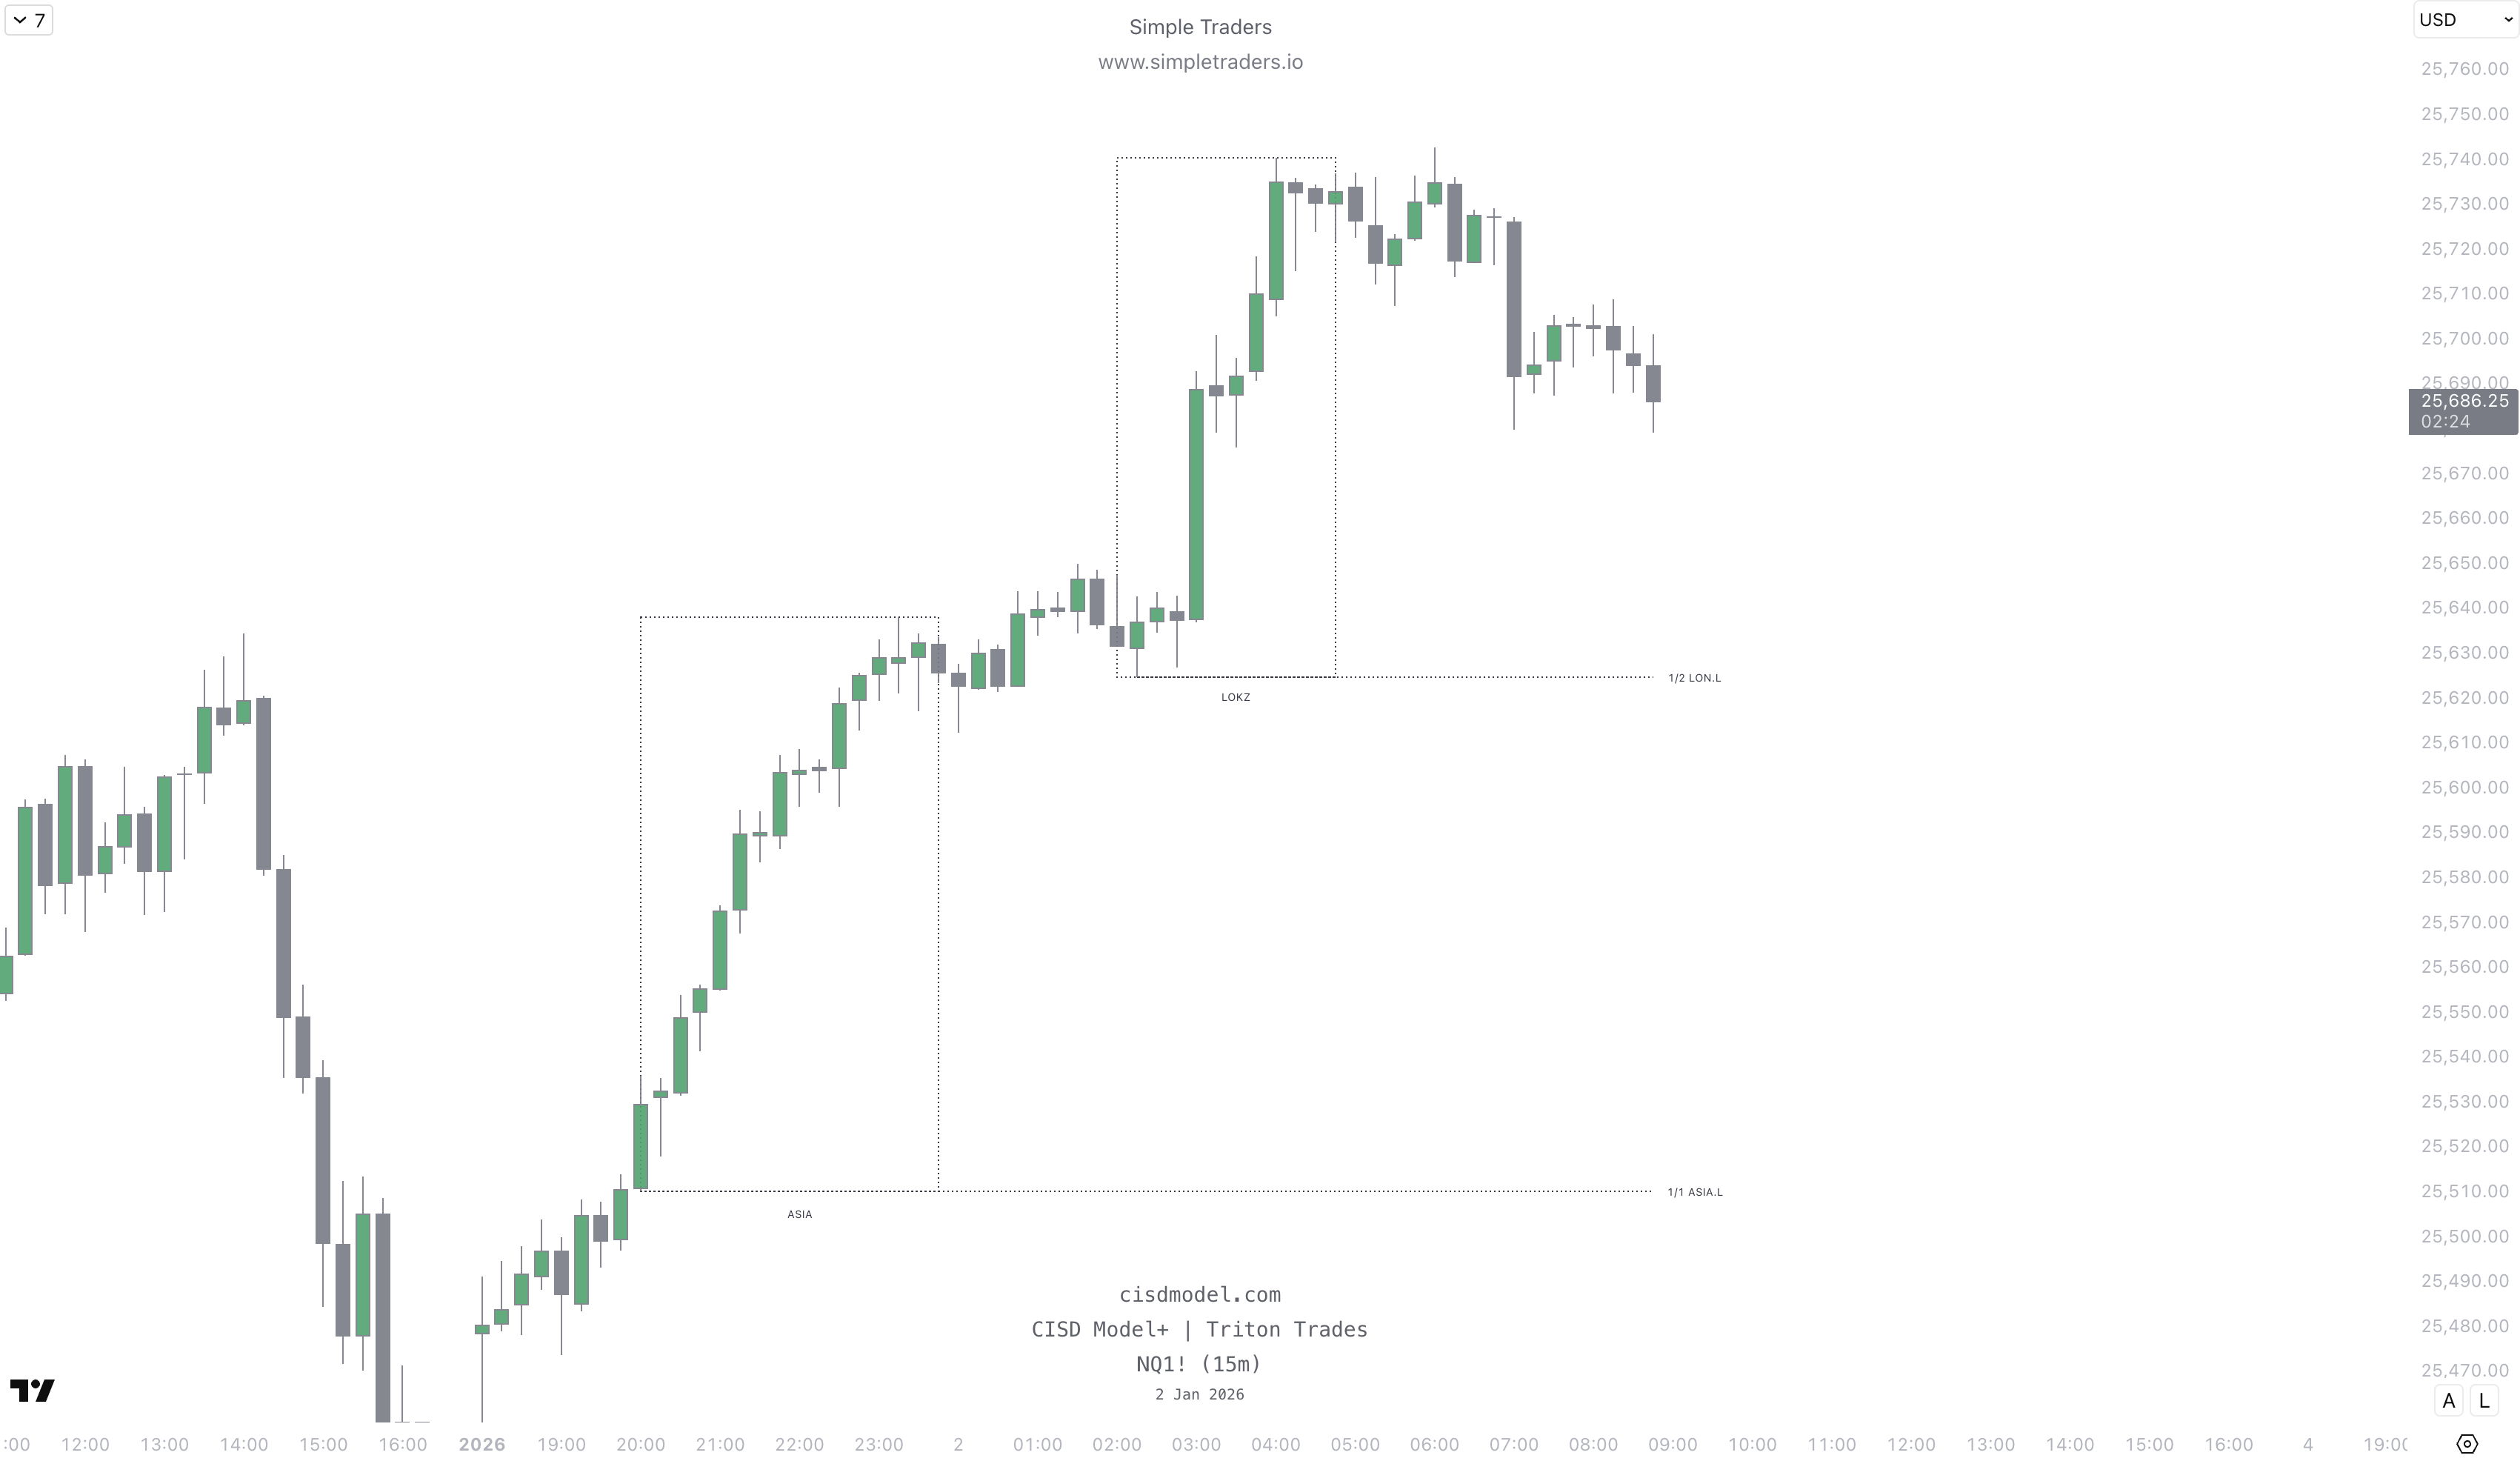
This feature marks out Session Liquidity on your charts.
This is based on the highs and lows of Asia, London, New York sessions.
You can also add & remove your own sessions by customizing the name & time window.
### Feature Overview
This feature marks out Session Liquidity on your charts.
This is based on the highs and lows of Asia, London, New York sessions.
You can also add & remove your own sessions by customizing the name & time window.
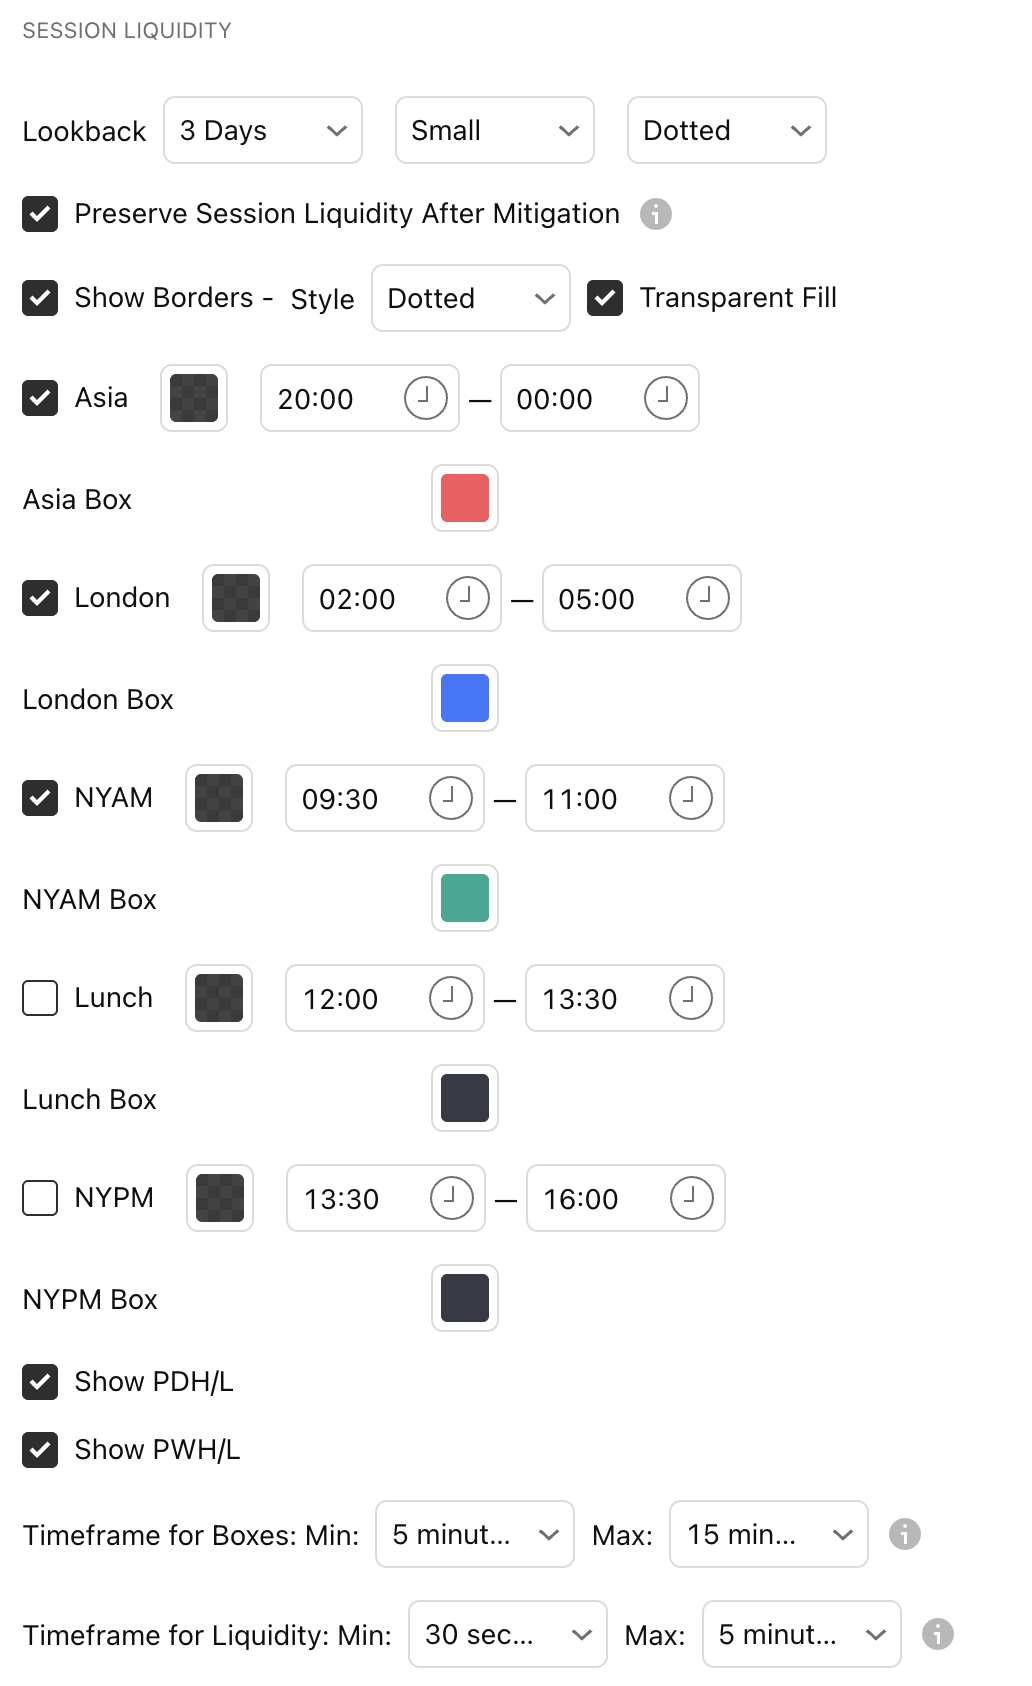
 ### Lookback
You can select how far back to look for session liquidity.\
You can choose between 1 day, 3 days, and 1 week.\
"Small" and "Dotted" refer to the label size and line style.\
### Preserve Session Liquidity After Mitigation
This will keep the session liquidity lines on the chart once price sweeps them. \
Keep it unchecked if you want the indicator to remove the lines after price sweeps the liquidity.\
### Show Borders
This shows the border for session boxes. \
Style refers to the border style (Dotted, Dashed, or Solid)\
Transparent Fill - turn on for a transparent fill on the session boxes. Turn off for a solid fill.\
### Sessions
Customize the timings and colors for each session, and show or hide individual sessions.\
### Timeframe for Boxes:
### Lookback
You can select how far back to look for session liquidity.\
You can choose between 1 day, 3 days, and 1 week.\
"Small" and "Dotted" refer to the label size and line style.\
### Preserve Session Liquidity After Mitigation
This will keep the session liquidity lines on the chart once price sweeps them. \
Keep it unchecked if you want the indicator to remove the lines after price sweeps the liquidity.\
### Show Borders
This shows the border for session boxes. \
Style refers to the border style (Dotted, Dashed, or Solid)\
Transparent Fill - turn on for a transparent fill on the session boxes. Turn off for a solid fill.\
### Sessions
Customize the timings and colors for each session, and show or hide individual sessions.\
### Timeframe for Boxes:
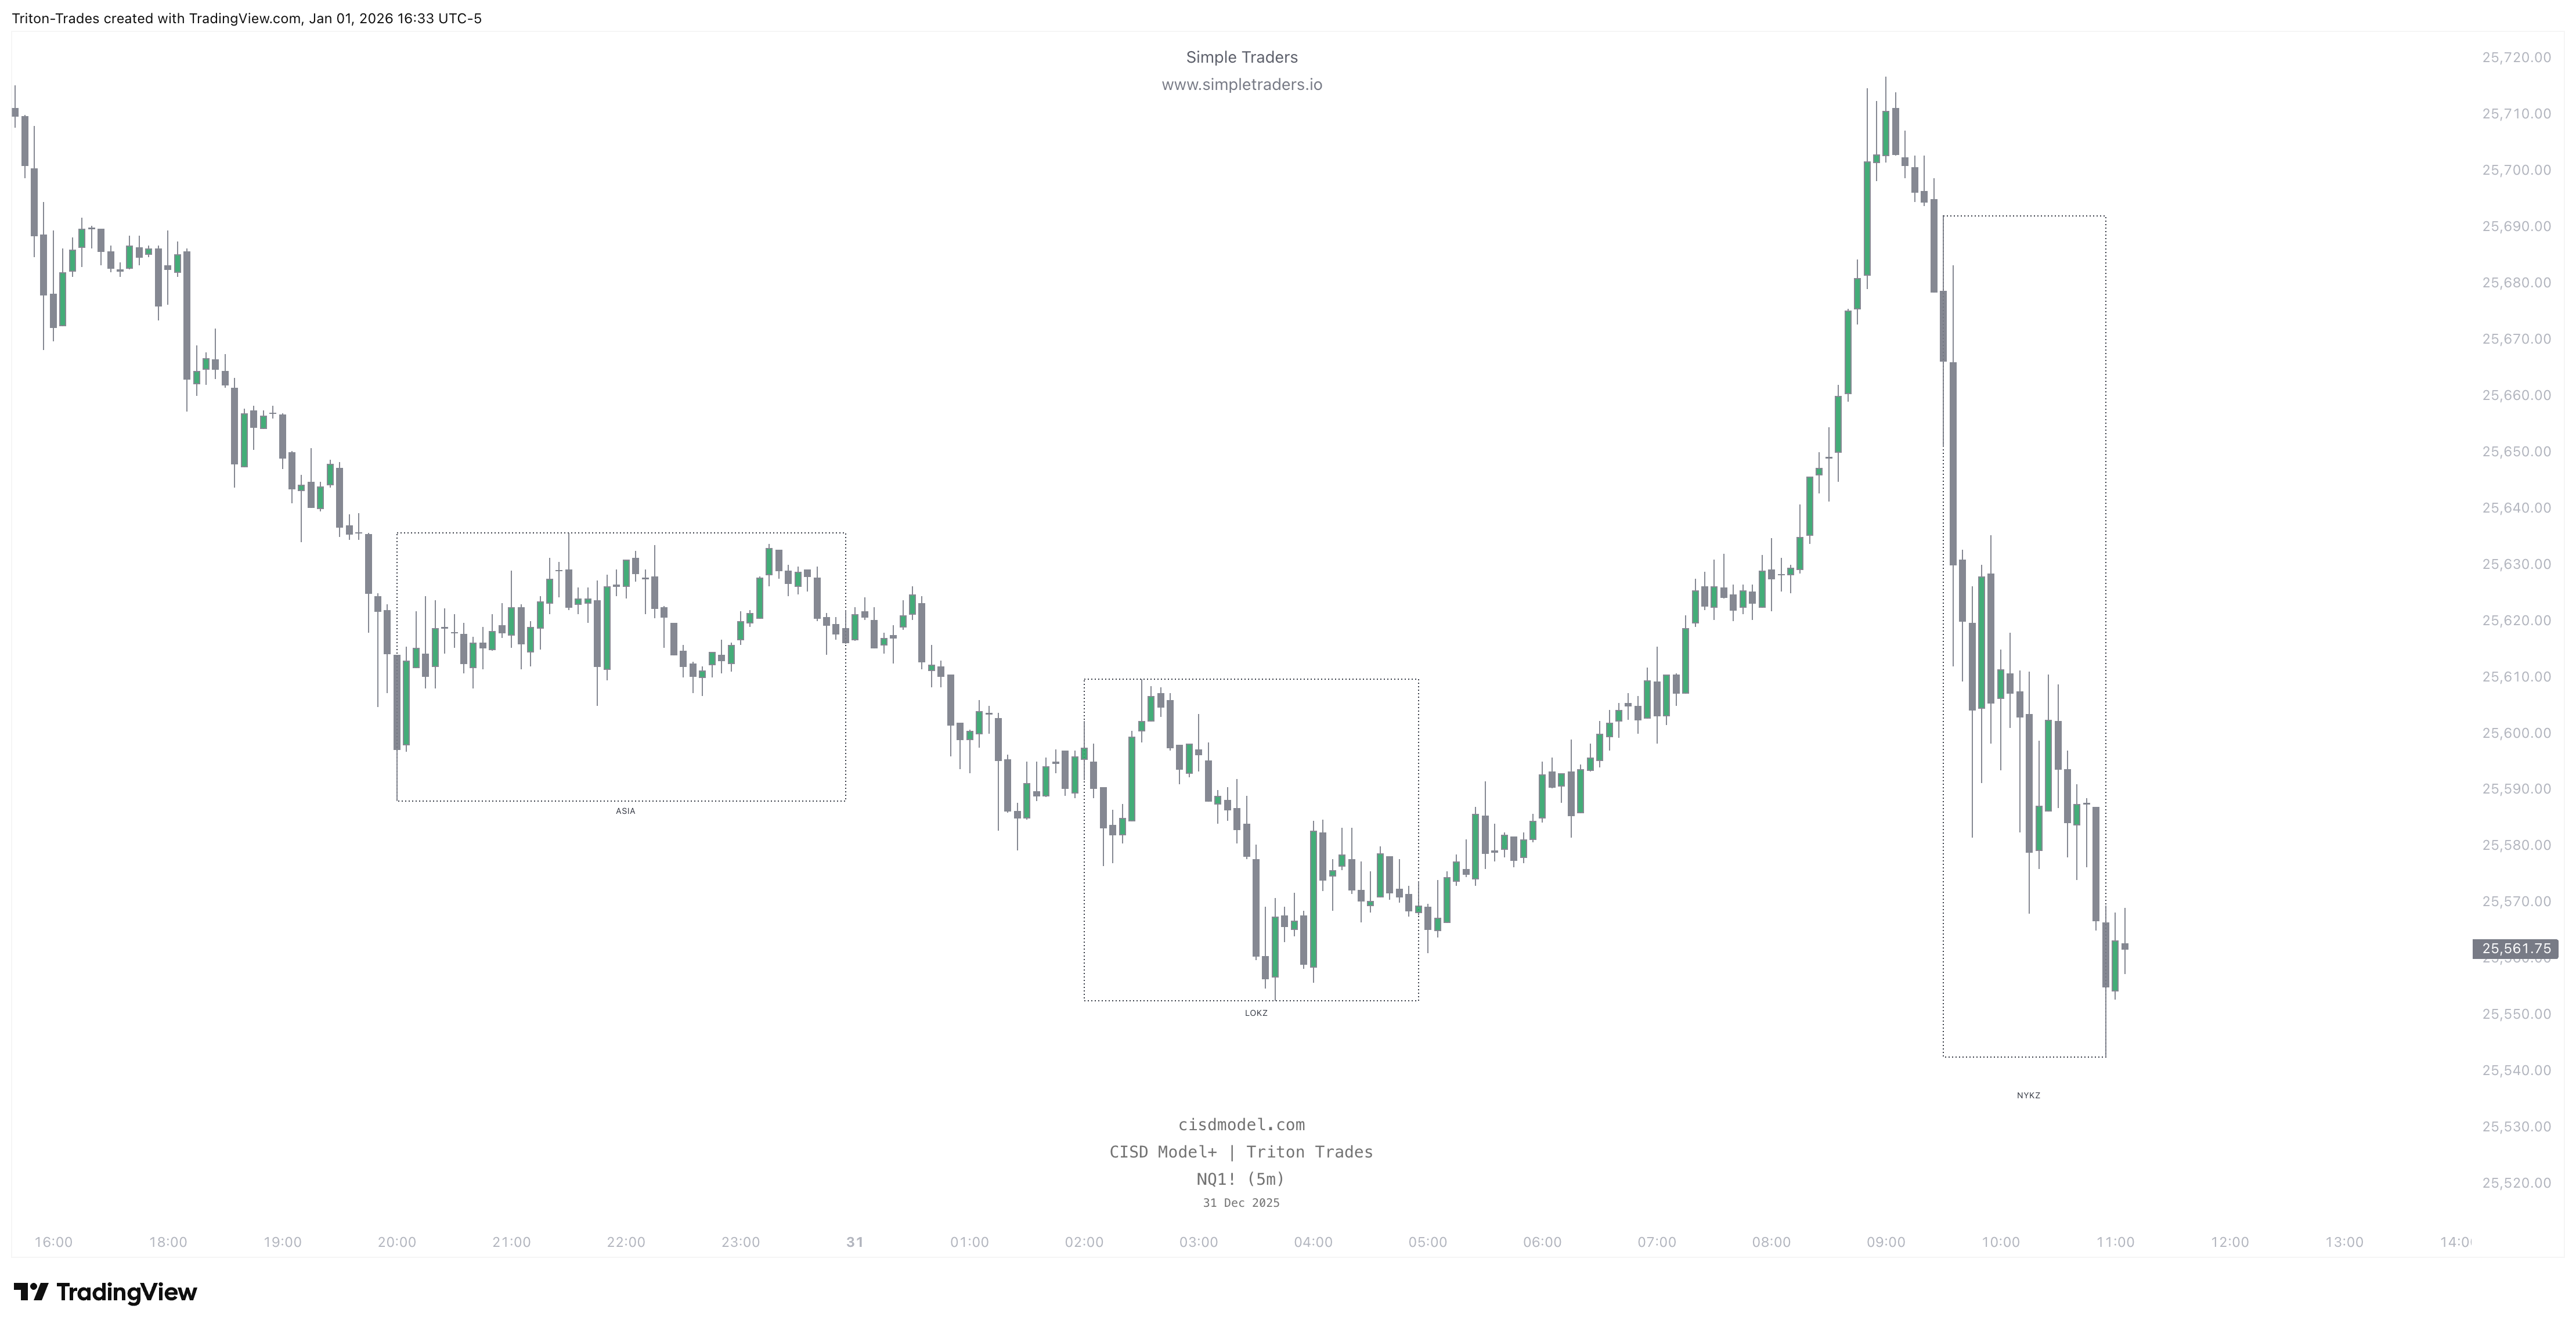 This will display session boxes as such, to help you visualize the price action during different market sessions.
You can choose which timeframes these session boxes will appear.
**Min:** The minimum timeframe to show the session boxes. Session boxes won't appear below that timeframe. Set to "chart" to have no minimum.
**Max:** The maximum timeframe to show the session boxes. Session boxes won't appear above that timeframe. Set to "chart" to have no maximum.
### Timeframe for Liquidity:
This will display session boxes as such, to help you visualize the price action during different market sessions.
You can choose which timeframes these session boxes will appear.
**Min:** The minimum timeframe to show the session boxes. Session boxes won't appear below that timeframe. Set to "chart" to have no minimum.
**Max:** The maximum timeframe to show the session boxes. Session boxes won't appear above that timeframe. Set to "chart" to have no maximum.
### Timeframe for Liquidity:
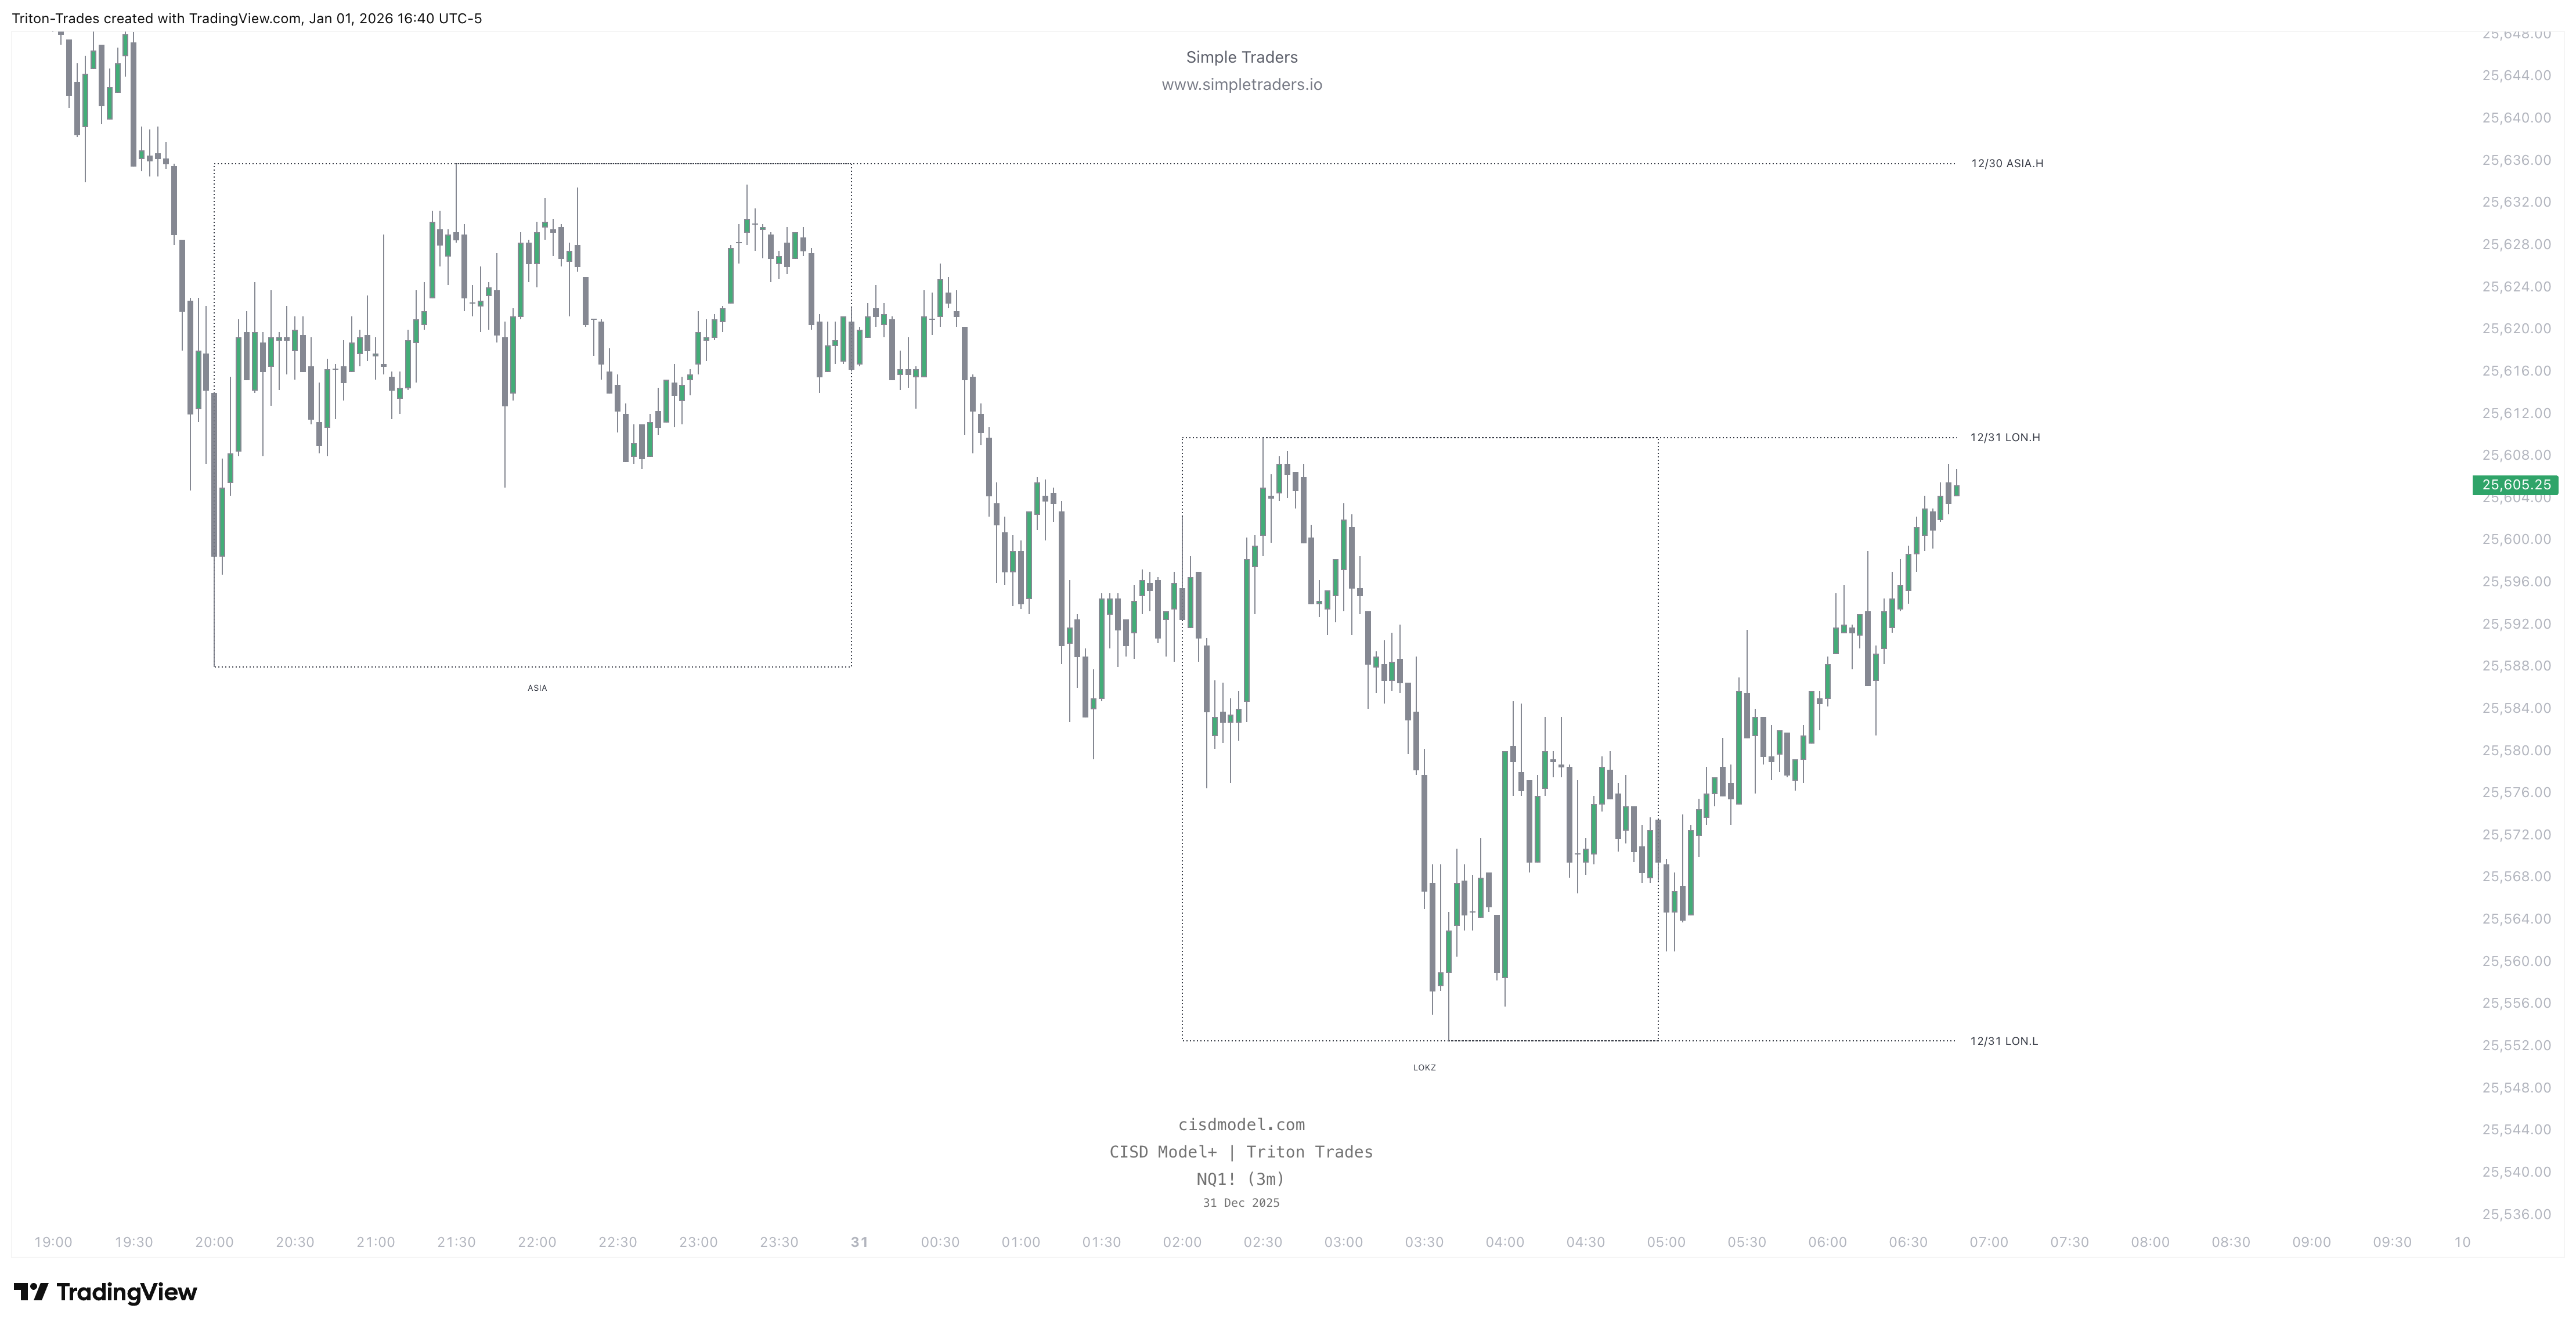 This feature extends the Highs & Lows of unswept session liquidity.
You can set which timeframes these lines are visible on.
**Min:** The minimum timeframe to show the session liquidity lines. The lines won't appear below that timeframe. Set to "chart" to have no minimum.
**Max:** The maximum timeframe to show the session liquidity lines. The lines won't appear above that timeframe. Set to "chart" to have no maximum.
This feature extends the Highs & Lows of unswept session liquidity.
You can set which timeframes these lines are visible on.
**Min:** The minimum timeframe to show the session liquidity lines. The lines won't appear below that timeframe. Set to "chart" to have no minimum.
**Max:** The maximum timeframe to show the session liquidity lines. The lines won't appear above that timeframe. Set to "chart" to have no maximum.